Session Timelines: See What Every Visitor Did, Second by Second (Without Recording Them)
I pulled every page visit from the last 30 days across the sites Clickport measures and looked at the ones where the tab slipped into the background for ten seconds or more. The median one sat open for 3 minutes and 11 seconds. The visitor read for 31 seconds of it. The rest of the time the page was buried behind another tab, a Slack window, or lunch.
Most analytics counts all of it as time on page. This week I shipped something that shows you the difference, one visit at a time: session timelines. Expand any visit and every page unfolds into reading stretches, away gaps, and events pinned to the exact second they happened. Without recording anyone.
- Session timelines are live in Clickport. Expand any visit and every page unfolds into reading stretches, away gaps, and events pinned to the second they happened.
- Nothing is recorded. No replay video, no screen capture, no cookies. The timeline is drawn from the same anonymous engagement events Clickport already collects.
- There's nothing to install and no tracker update. Timelines work retroactively, so your existing traffic already has them.
- Why it matters: most 'time on page' is tab-open time. In our data, when a tab went to the background for 10+ seconds, the median page sat open for 3:11 but was read for 31 seconds.
- You get the answer session replay promises, what did this visitor do, without the liability: a Princeton study found replay scripts on 482 top sites, some leaking passwords and credit card numbers.
What is a session timeline?
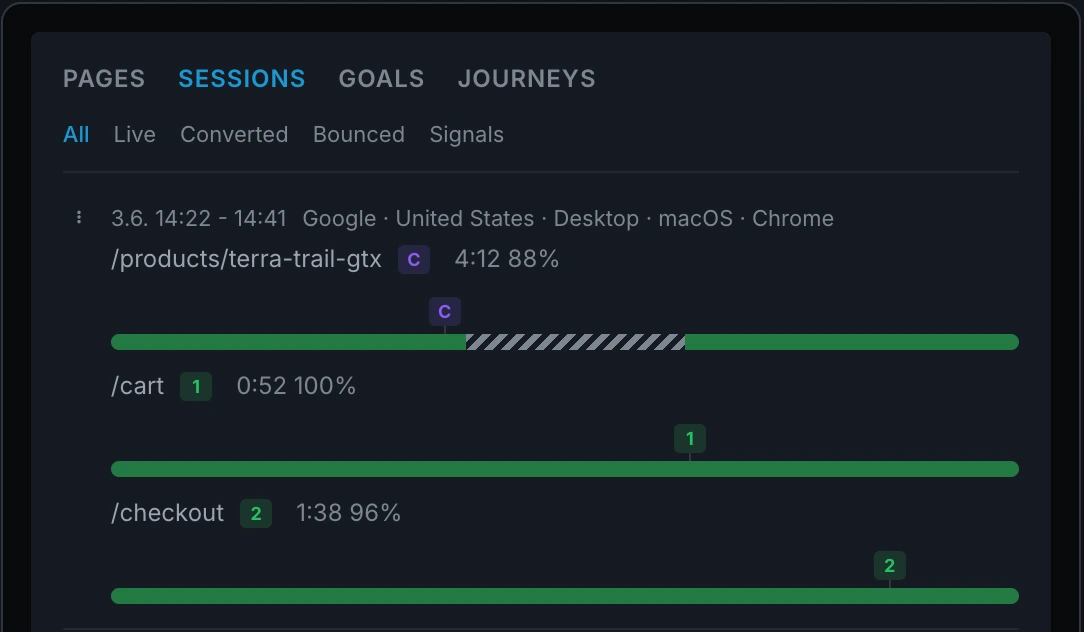
A session timeline is a second-by-second playback of one visit, drawn from analytics events instead of a screen recording. Each page of the visit gets a bar, and you can read it like a sentence: green stretches where the page was in front of them, hatched gaps where the tab sat in the background, and badges marking the moment they copied text, hit a broken button, converted, or triggered a script error.
Here's a real shape, from an online outdoor store. One visitor, three pages, one purchase:
Read it top to bottom and the visit tells its own story. Four minutes reading a product page, a text copy a third of the way in, then the tab goes dark for over a minute. Then they come back, read again, and head to the cart. Straight through checkout, purchase pinned near the end.
That middle gap is my favorite part. It's the visitor thinking.
Most "time on page" is tab-open time
Analytics tools have historically clocked time on page as the gap between opening a page and leaving it. If you've ever trusted that number, it's worth knowing what's inside it. The problem: your visitors keep pages open in background tabs for minutes or hours, and a naive timer keeps counting the whole way.
I wanted to know how big that problem really is, so I measured it across our own traffic. Three numbers stood out:
15.4% of page visits contain a background gap of 10 seconds or more. At the session level it's 18.3%, nearly one visit in five. Put another way: on a site with 1,000 visits a day, around 180 of today's sessions include at least one stretch where your page was open and nobody was looking at it.
When a page does go into the background, it stays there a while. The median gap is 130 seconds. That's not a quick tab flick. That's someone leaving to do something else and coming back later, or not coming back at all.
In aggregate, background time dominates. Of all the open-tab time in the sample, 73% was background time. Exclude the single highest-traffic site and it's still 59%. Meaning: summed across all visitors, your pages spend more total time buried behind other tabs than being read.
Most individual visits are short and fully engaged; the median visit reads straight through. But the long "time on page" numbers, the ones that make a report look good, are exactly the ones most likely to be inflated by a parked tab.
How I measured it
I took every page visit from a subset of the sites we measure, over the 30 days ending July 6, 2026, and kept the ones with at least one pageview, at least one engagement report, and a wall time between 1 second and 2 hours. That left 454,246 page visits. Requiring an engagement report also filters out most bots, which rarely send one.
For each visit I compared two clocks: wall time (last event minus first event) and engaged time (the visibility-aware timer Clickport's tracker already runs, which pauses whenever the tab is hidden). The difference between the two is background time. A gap counts when it exceeds 10 seconds.
One honest caveat: this sample can't say anything about visits that never send an engagement report, and the aggregate 73% figure is dominated by high-traffic sites, which is why I also report it with the largest site excluded. The per-visit medians barely move either way.
No new tracking, nothing to install
Here's the part I'm most pleased with: the timeline needed no new data.
Clickport's tracker has always sent cumulative engagement updates as a visitor reads, pauses when the tab is hidden (via the browser's Page Visibility API), and reports again when they return or leave. The dashboard used those reports for totals: time on page, engagement scores, bounce checks. Then it threw the timestamps away.
The timeline simply stops throwing them away. Each engagement report says "by this second, the visitor had read for this long." Line those up and the reading stretches and away gaps fall out. The event badges you already see on a session, the copies, the rage clicks and dead clicks, the conversions, carry timestamps too, so they pin straight onto the bar.
No new script. No bigger tracker. No schema change. And because the events were already there, it works backwards: the day I shipped it, every existing session on every Clickport site already had a timeline. If you were tracking with Clickport last month, your April traffic has timelines too. You don't have to wait for new visits to see it.
Every event, pinned to the second
A bar of reading and gaps is nice. The badges are what make it useful to you. The timeline pins the same events you see inline on a session, at the moment they happened:
- Copied text (purple C): what they copied, and exactly when. A copy of a coupon code right before an away gap tells you where they went.
- Conversions (green badge): the goal badge itself, pinned at the second the goal fired. Time-to-conversion, visible without a report.
- Rage clicks and dead clicks (red R, amber D): not just "this page frustrated someone" but when. A rage click 4 seconds in is a broken button. One at 3 minutes is a visitor who tried everything else first.
- Script errors (red E): the error and the second it fired, next to what the visitor did about it.
Hover any badge and you get the same detail popup you get inline: the copied text, the element that was clicked, the error source.
Watching a live visit
In the realtime view, timelines don't just replay. A visitor who's on your site right now gets a dashed "on page now" tail on their current page, and it grows as they read:
Someone's reading your pricing page right now. You can watch the green stretch grow. It's strangely calming.
The insight of session replay, without the recording
The obvious comparison is session replay: tools that record every mouse movement, keystroke, and scroll into a video you can play back. Replay answers the same question timelines do, "what did this visitor do?", and I'll be honest about where it's stronger: pixel-level rendering bugs, mouse hesitation inside a form field, watching someone fight a broken layout. A timeline won't show you any of that.
But recording is a heavy price for it. A 2017 Princeton study found session-replay scripts on 482 of the top 50,000 sites, capturing full page contents and keystrokes, in some cases leaking passwords, credit card numbers, and prescription names to third parties. France's data protection authority considers the practice sensitive enough that CNIL opened a public consultation on rules for it. And a recording of a person's session is personal data, so under GDPR you're back to needing consent for it.
The timeline takes a different trade. No video. No screen capture. No cookies, and no consent banner needed, because everything's rebuilt from the same anonymous engagement events Clickport already uses for its totals. You give up the pixels and keep the story: what they read, for how long, where they hesitated, what they copied, where it broke, and when they bought.
For most "why didn't this visit convert?" questions, the story's enough.
FAQ
Do I need to update my tracker to get session timelines?
No. Timelines are reconstructed from engagement events Clickport already collects, so they appeared on all existing sessions the day the feature shipped. If Clickport's on your site, you already have them: open the Sessions panel and click any visit.
Does the timeline use cookies or need a consent banner?
No. It's built from the same cookieless, anonymous events as the rest of Clickport. Nothing is stored on the visitor's device and no personal data is kept, so there's nothing to ask consent for.
What does an away gap mean exactly?
The visitor's browser reported the tab as hidden: they switched tabs, minimized the window, or moved to another app. The timer pauses, the timeline draws a hatched gap, and reading resumes when they come back.
How precise are the segments?
Engagement updates are sent when there's meaningful new reading or scrolling, so very rapid tab-flipping can merge into one segment. Within a hide-and-return span, the timeline knows exactly how much reading and how much away time happened, and draws reading first. Badges are pinned at their event's own timestamp, to the second.
Is this the same as session replay?
No. Session replay records a video of the visitor's screen, including mouse movement and keystrokes, and needs consent under GDPR. A session timeline is drawn from anonymous analytics events: you see reading, gaps, and events on a bar, not a recording of a person.
Averages tell you what happened. A timeline shows you how.
Every number on a dashboard is a compression. Time on page compresses a visit into one figure and, as it turns out, mostly measures how long a tab stayed open. The timeline is what that figure was hiding: the reading, the pause to think, the copy of a coupon code, the return, the purchase.
You can try Clickport free for 30 days and open the Sessions panel on your own traffic; timelines are on every plan, including your existing sessions from before today. If you're coming from a replay tool and wondering what you'd miss, read how session tracking works or write to me.

Comments
Loading comments...
Leave a comment