Clickport vs Google Analytics: Cookieless vs GA4
Every comparison article tells you to switch off Google Analytics. Almost none of them admit what you give up when you do. So this is the version that does.
GA4 is free, and for one kind of business that price is worth it. For everyone else it costs you 40-60% of your EU traffic behind consent banners, 134 KB of JavaScript on every page, and a 24-48 hour wait to see yesterday's numbers.
I'll show you exactly where the line falls.
- GA4 wins on Google Ads integration, cross-device tracking, predictive audiences, and BigQuery export. No privacy-focused tool replicates these.
- Clickport wins on privacy compliance (no cookies, no consent banners), data accuracy (no ad blocker losses), page speed, and usability.
- GA4 is free but costs $5,000-$18,000/year when you include setup, consent banners, training, and compliance. Clickport starts at €9/month.
- 75% of SEOs report being unhappy with GA4 more than two years after launch.
- If you run Google Ads and need retargeting audiences, GA4 is the better choice. For everything else, a privacy-first tool gives you more accurate data with less overhead.
Let's start with where GA4 wins
Let me do the part most comparison articles skip. GA4 has real strengths. No privacy-focused tool can copy them, mine included. If you lean on any of these, GA4 might be the right call for you.
If you run Google Ads and lean on retargeting audiences, GA4 is hard to replace. The link between GA4 and Google Ads is tight, proprietary, and worth real money for paid acquisition. If your marketing team lives inside Google's tools, staying on GA4 is the sensible move.
So there's really only one question that matters. Do you use any of it?
Most site owners don't. 54% of websites with Google Analytics don't have a single goal configured. Which means more than half never even told GA4 what a win looks like. 81% record zero email tracking sessions. The average local business gets 414 unique visitors per month.
That's not a data team's workload. These owners don't need predictive audiences or BigQuery. They need to know where their traffic comes from and what pages people read.
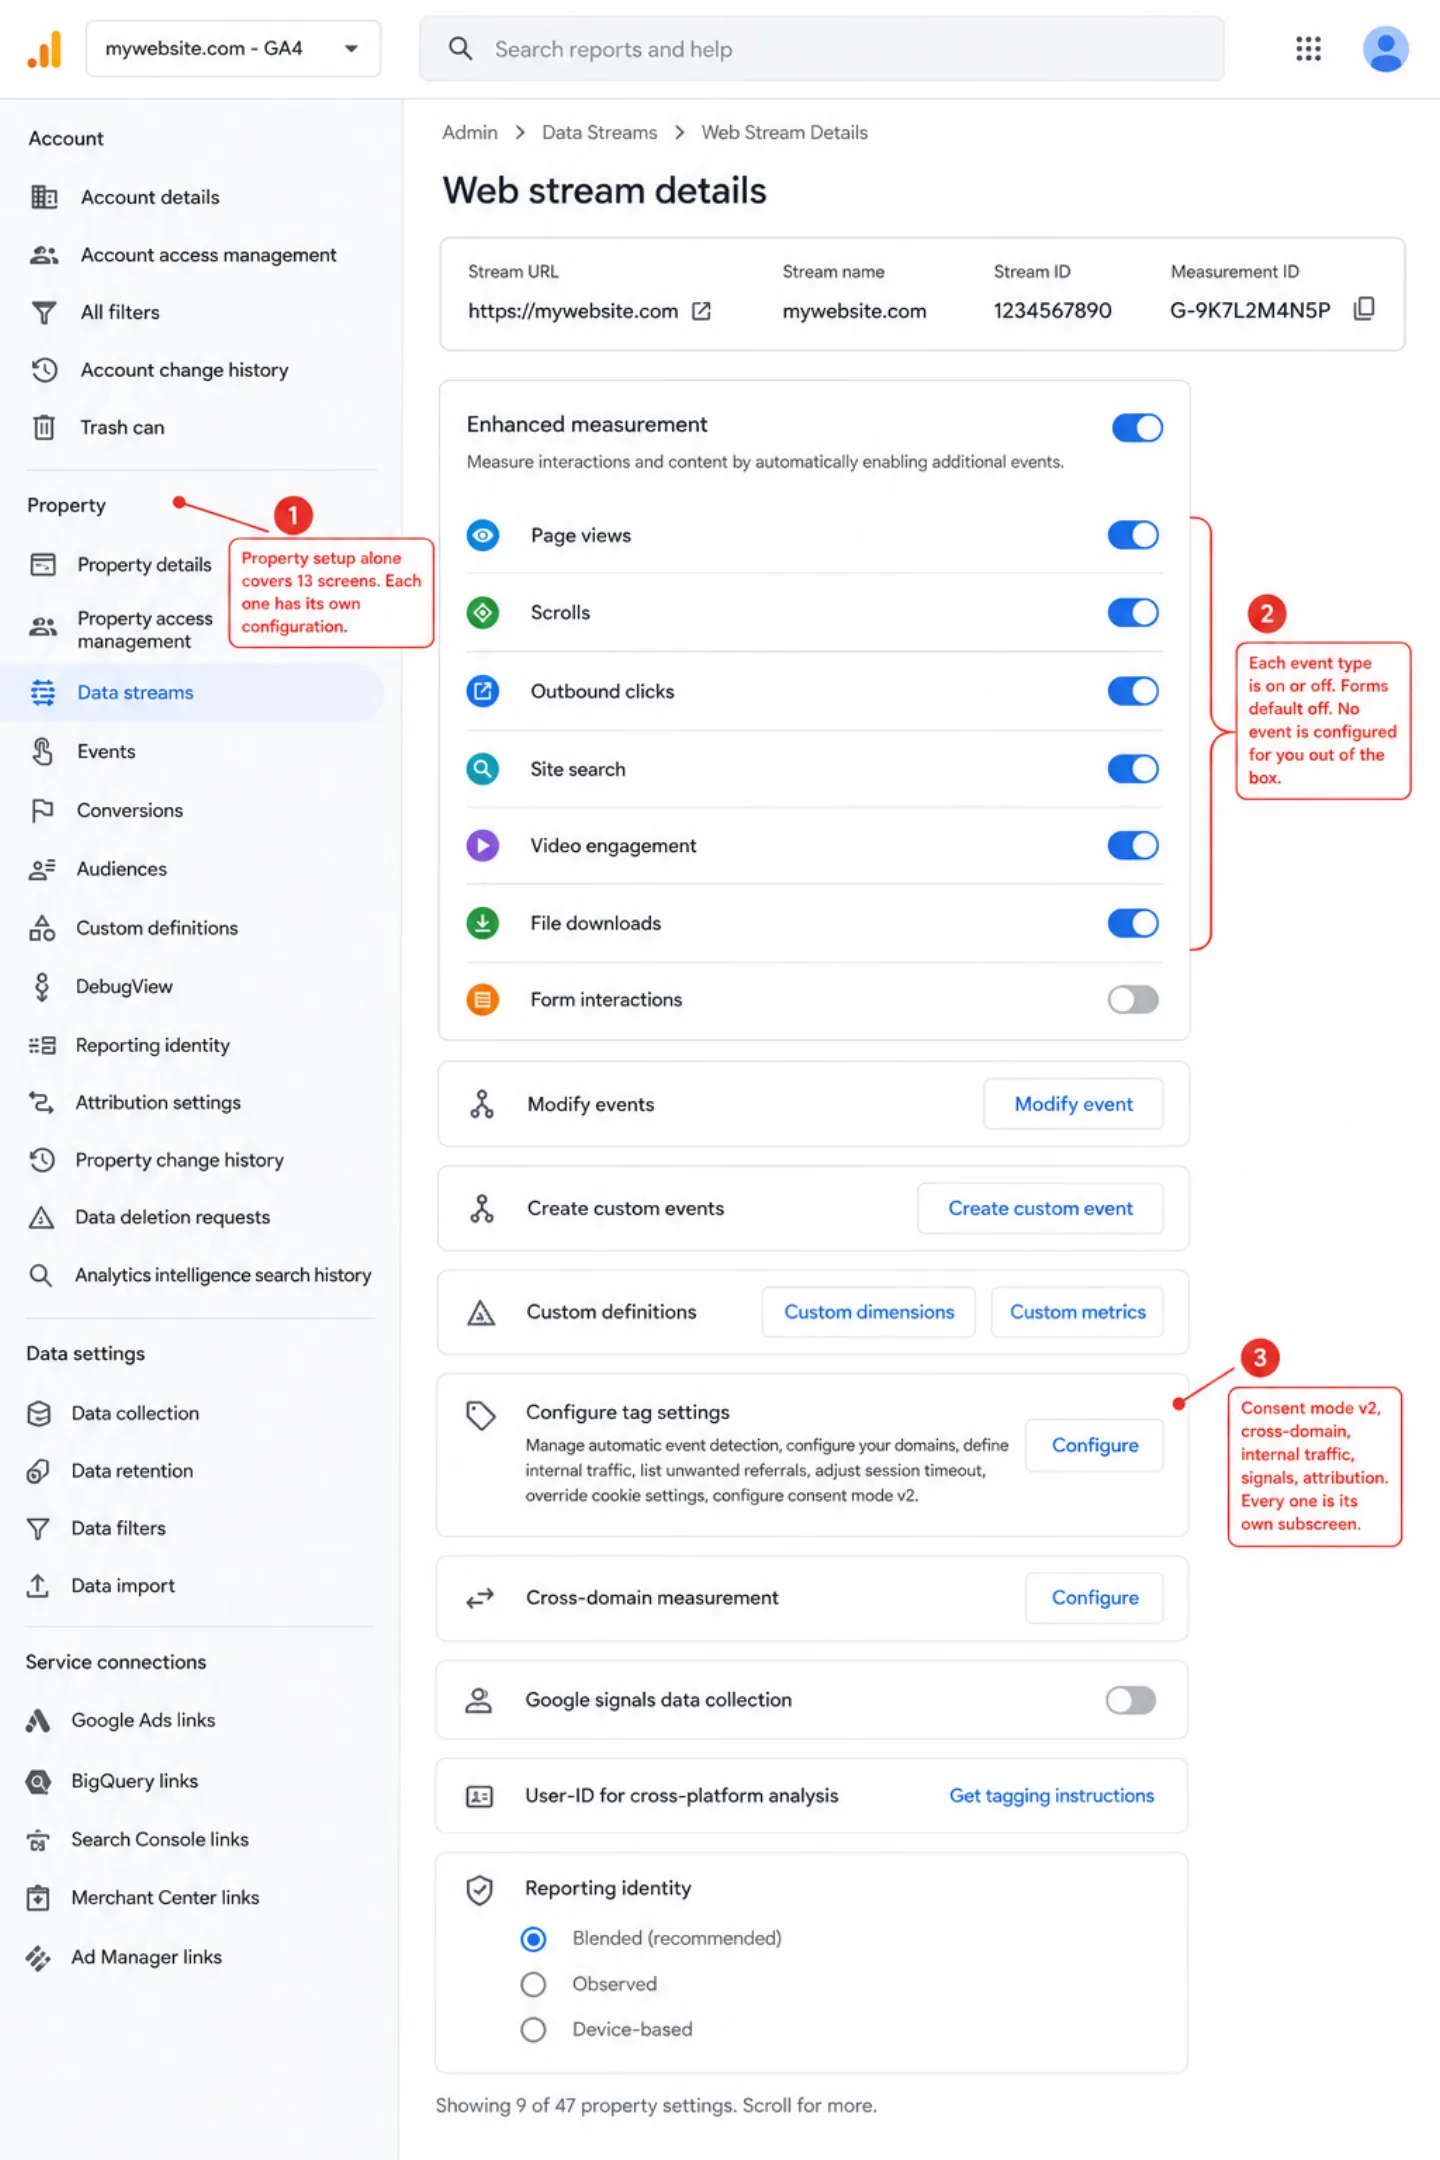
GA4 was rebuilt for enterprise data teams. If you're not one, you're paying the complexity tax on features you'll never touch.
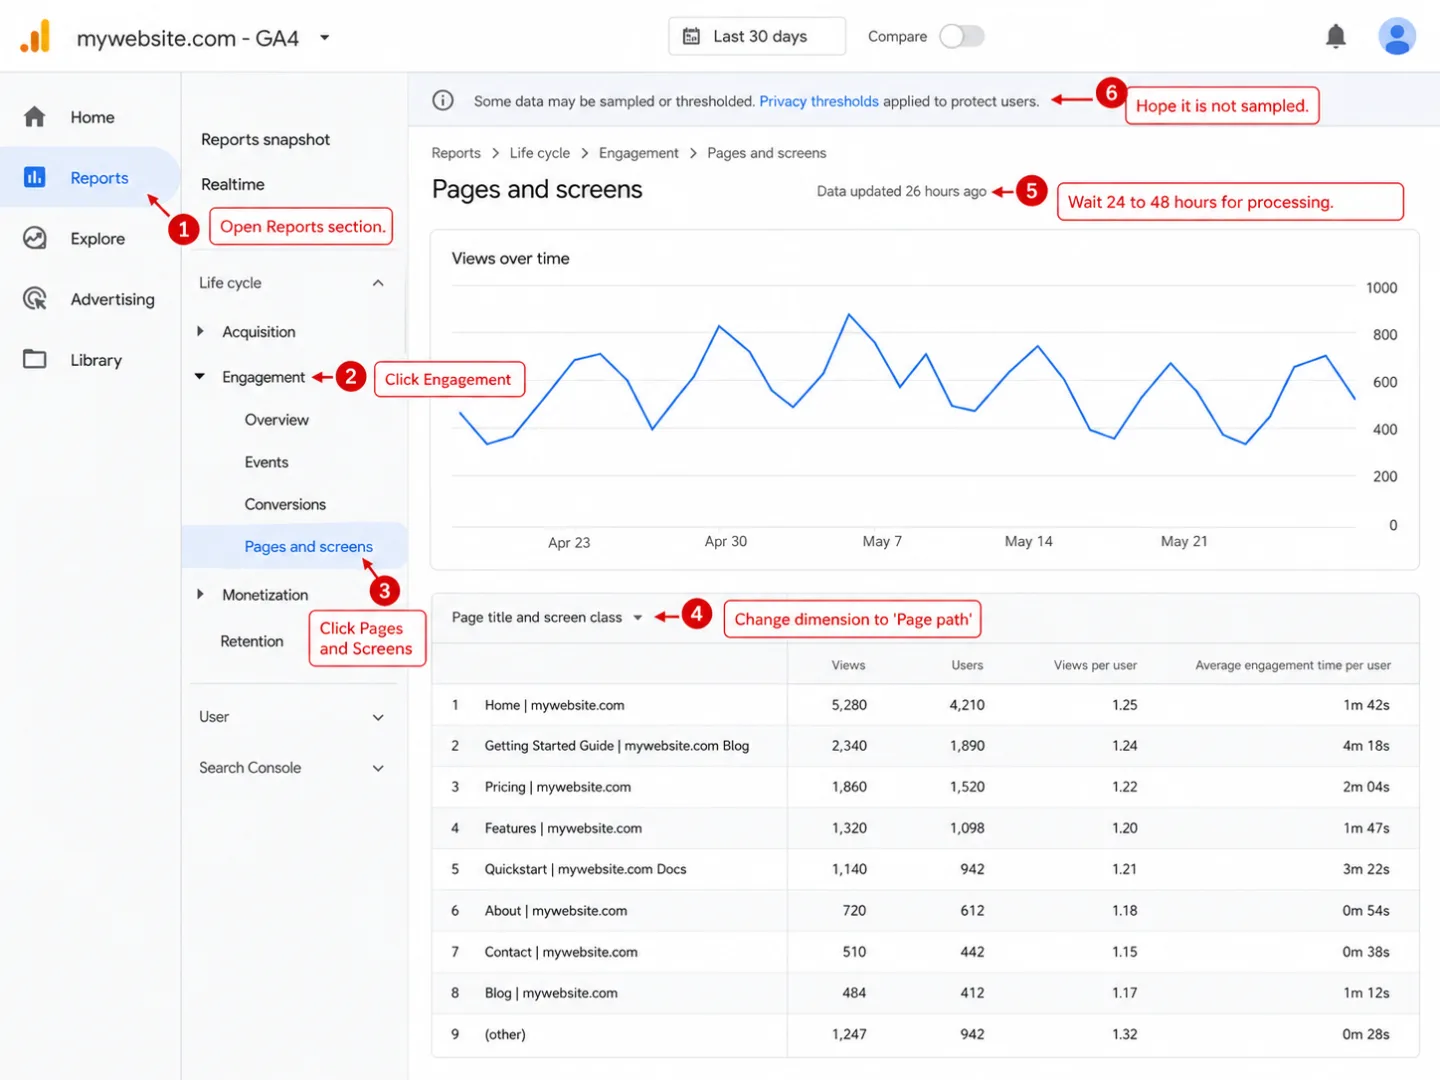
The tool that needs a $500 course to understand
Universal Analytics had its problems, but you could figure it out. You opened the dashboard, clicked "Audience Overview," and saw your traffic. Two clicks. Done.
Then GA4 replaced all of that. New event-based data model. New interface. New words for old things. A whole new way of thinking about your own website.
Tasks that took 2 clicks in Universal Analytics now require 6 or more steps in GA4. That means the same answer costs you three times the work. The standard report library shrank from more than 30 acquisition reports to just 2. Over 200 dimensions were cut down to 87. Bounce rate was pulled out entirely, then quietly added back with a definition that means something else.
None of this made your job easier.
The learning curve isn't just steep. It costs money. GA4 training courses run $325 to $650. Getting genuinely good at it takes 4 to 6 months of steady use, so half a year before the tool feels like yours. One blogger paid $500 for a GA4 course and still hadn't finished 60% of it. Experienced GA4 consultants charge $100 to $250 per hour to do what you can't.
As one Hacker News commenter put it: "It's rare that an interface makes me feel as dumb and frustrated as GA4."
GA4 was built for data engineers. It wasn't built for the site owners who need analytics the most. Most people don't want a decoder ring. They want answers.
You're making decisions on a fraction of your data
GA4 has three separate data quality problems. Most people who use it don't know about a single one.
Problem 1: Ad blockers. Over 42.7% of internet users run ad blockers, so close to half the web is already armed against tracking scripts. Popular tools like uBlock Origin, Ghostery, and the Brave browser block GA4 by default. On tech-focused sites, blocking reaches 58% of visitors. B2B sites lose 36.76% of visits. And the visitors you lose aren't a random sample. They skew technical, privacy-minded, and often higher-income. Your data isn't just thin. It's bent in one direction.
Problem 2: Consent rejection. In the EU, GA4 needs a cookie consent banner. Done properly, 60-70% of visitors reject it, which means most people simply say no to being counted. The UK's own privacy regulator, the ICO, lost 90.8% of tracked traffic after putting a compliant banner on its own website. Stack ad blockers on top of consent rejection and you're easily down to seeing only half to two-thirds of your real traffic.
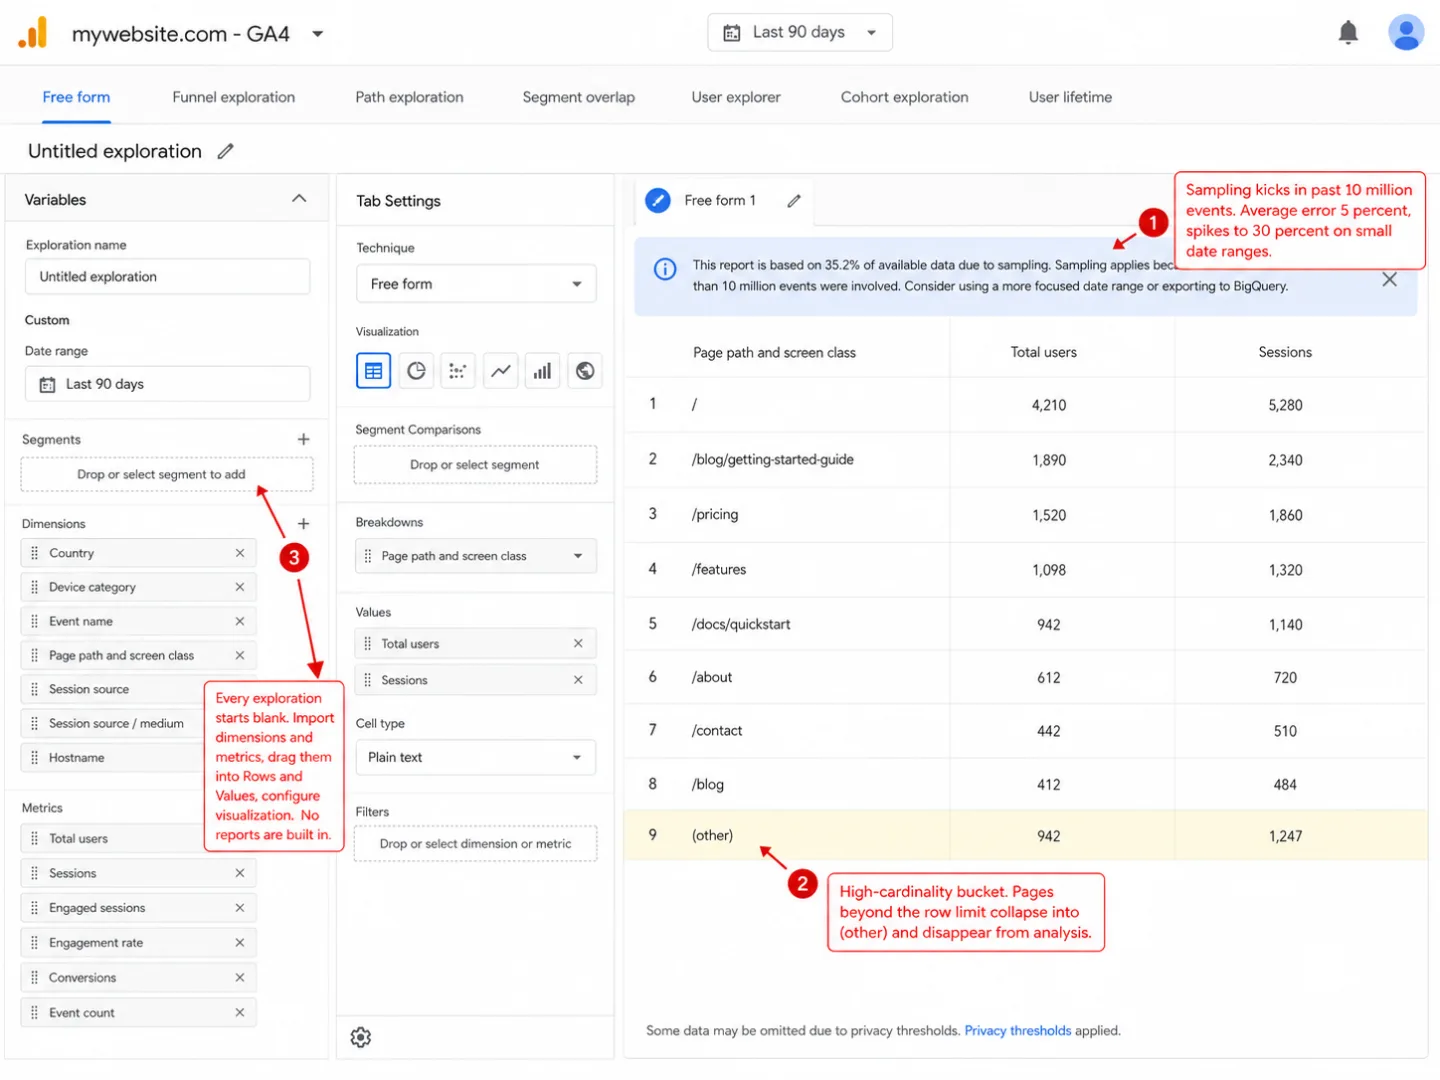
Problem 3: Data sampling. Once an Exploration report passes 10 million events, GA4 stops counting everything and starts guessing from a sample. Errors sit around 5% on average but can jump to 30% on smaller date ranges. Which means the number you're reading might be a third wrong.
On top of that, GA4 hides rows behind data thresholds when too few users match your filter. And dimensions with high cardinality get swept into a bucket called "(other)" once the report hits its row limit.
One developer ran Google Analytics and a privacy-first tool side by side on the same site. The privacy-first tool reported 30-40% more pageviews. It wasn't inflating anything. GA4 was simply missing that much traffic.
You can't make good decisions on bad data. And when a third to a half of your visitors never show up, the data isn't a little off. It's telling you the wrong story. Your conversion rate looks great because the denominator is missing people. Your traffic sources are skewed because consent rates vary by 36% depending on the channel, so some sources get undercounted more than others. Your top pages are wrong because the people running ad blockers browse differently from the people who don't.
Clickport uses no cookies, needs no consent banner, and loads from your own domain, not a third-party one ad blockers hunt for. So it sees everyone. Not 30%. Not 70%. Everyone.
Want to know how big the gap is on your own site? The GA4 Data Loss Estimator takes your industry and region and breaks the loss down by cause. Flip a toggle and you see the unblocked version of the same site.
The 134 KB tax on every visitor
Google ranks slow websites lower in search. Google's own analytics script is one of the heaviest third-party scripts on the web. Both of those things are true at the same time, and Google has never resolved the contradiction.
GA4's gtag.js loads 134 KB of compressed JavaScript and 371 KB uncompressed. That's a 6.7x increase over Universal Analytics, so the upgrade made the script nearly seven times fatter. It fires off requests to several domains (googletagmanager.com, google-analytics.com, stats.g.doubleclick.net), and each one needs its own DNS lookup, TCP handshake, and TLS negotiation before a single number reaches you.
In the real world that adds 100 to 500 milliseconds to your page load. One developer watched their site's Time to Interactive double from 2 to 4 seconds after adding a single GA4 pageview call, so one tracking line cut their site's responsiveness in half. A controlled 500-run Lighthouse test measured roughly a 4% drop in performance score from GA4 alone.
Then it gets stranger. Google's own Lighthouse tool flags Google's own scripts for breaking Google's own caching advice. GA4 ships with a 2-hour browser cache, while Lighthouse tells you to cache static assets for at least a year. Developers on Lighthouse's GitHub have pointed this out plainly. Google's performance tool docks you for using Google's services.
On a typical WordPress site (around 400 KB of JavaScript), GA4 bumps the scripts a browser has to parse by roughly 98%. That nearly doubles the work every visitor's browser has to do. All for a tool that calls itself free.
Seven countries say it's illegal
Between January 2022 and July 2023, seven European data protection authorities ruled that using Google Analytics breaks GDPR. Not one. Seven, in eighteen months.
All seven rulings trace back to one place: the Schrems II decision from the Court of Justice of the European Union, which struck down the EU-US Privacy Shield. The finding was blunt. US surveillance laws give government agencies too much access to personal data, and Google, as an "electronic communication service provider" under FISA, can be compelled to hand data over to US intelligence.
The EU-US Data Privacy Framework, adopted in July 2023, calmed the situation for now. But "for now" is doing a lot of work. The Trump administration removed all three Democratic members of the Privacy and Civil Liberties Oversight Board in January 2025, and the independence of that very board was central to the EU Commission's adequacy finding. Privacy advocates already expect a "Schrems III" challenge. If the framework falls, every website running GA4 in Europe is back where it started.
And there's a catch with Consent Mode v2 that should give you pause. When a visitor denies consent under Google's "Advanced" setup, the tags still fire. They send "cookieless pings" carrying timestamps, user agent data, referrer URLs, and more. So "no" doesn't always mean nothing leaves. Brian Clifton, former Head of Web Analytics for EMEA at Google, wrote that Consent Mode "breaks privacy laws" because it sends data to Google before consent is given.
The business model underneath is the real problem. Google makes its money on advertising. In 2024, the vast majority of Alphabet's revenue came from ads. GA4 feeds that machine, handing Google detailed behavioral data from 14 million websites. Turn on Google Signals and GA4 ties your visitors' browsing to their Google account for cross-device ad targeting. The Italian regulator named this outright, pointing to Google's "capabilities to enrich such data through additional information it holds."
When the product is free, your visitors' data is the product.
Clickport is hosted in Germany on Hetzner servers. Your data never leaves the EU. No sub-processors touch visitor data. No Google account linking. No advertising integration. No Schrems risk. The business model is simple: you pay for analytics, and that's the whole arrangement. There's no data to sell because the income comes from you, not advertisers.
The "free" tool that costs $6,000 a year
GA4's price tag says zero. The price tag is the cheapest part. Add up what it takes to make GA4 work and "free" stops meaning much.
That reporting time overhead is worth spelling out. Say someone on $50 an hour spends 3 extra hours a week fighting GA4's interface instead of glancing at a single-page dashboard. That's $7,800 a year gone, on reports, not the work the reports were meant to inform. I used a gentler estimate for a small team in the table above. The point doesn't change. Your time has a price even when the software doesn't.
At the enterprise level the numbers stop being funny. GA4 360 starts at $50,000 a year. Agency retainers for GA4 management run $2,000 to $10,000 a month. OneTrust for enterprise consent management costs $10,000 to $27,000 a year. A mid-market company can spend six figures a year on what started life as a "free" analytics tool.
And after all of that, you still don't get real-time data. GA4's standard reports run 24 to 48 hours behind, so you're paying a fortune to look at yesterday. You still lose 15-30% of visitors to ad blockers. And your data retention is capped at 14 months unless you wire up BigQuery yourself.
Clickport's 100k pageview plan is $19 a month. Setup takes five minutes. There's nothing else to buy.
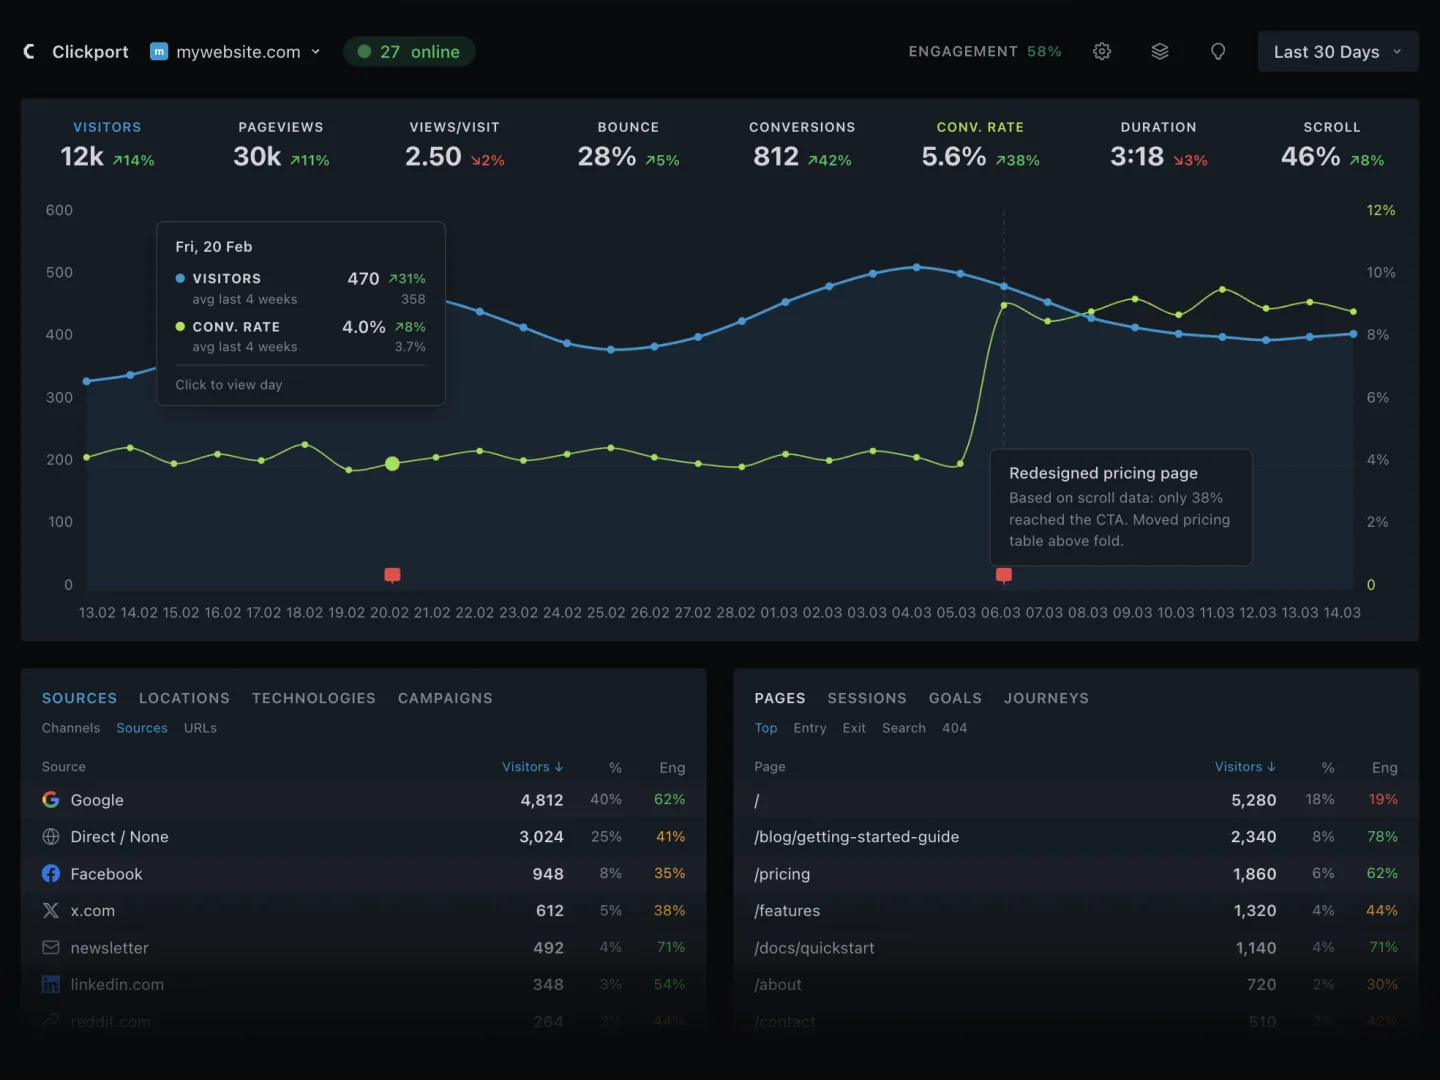
What 90% of site owners actually need
Most website owners are trying to answer seven questions. Not 200-plus dimensions. Not 87 metrics. Not exploration reports with custom segments. Seven plain questions.
Clickport answers all seven on a single dashboard page. KPIs across the top. Chart below them. Tabbed panels for sources, countries, pages, campaigns, goals, technology, sessions, and more. No training. No configuration. No Tag Manager. You add one script tag and the data starts flowing.
GA4 can answer these seven too. It just buries them under layers of enterprise machinery. As one analysis put it: "GA4 was made fundamentally better for power users and data analysts, but in doing so, it became unnecessarily complicated for the 90% of business owners who simply needed quick, basic reports."
Features GA4 doesn't have
Here the comparison turns around. These aren't softer versions of GA4 features. They're things GA4 can't do at all.
AI agent analytics
A growing share of your traffic isn't people anymore. It's AI agents: ChatGPT fetching your pricing page for someone who asked about you, Perplexity citing your docs in an answer, assistants reading your comparison pages before recommending anything. GA4 can't see any of this. Its tracking depends on JavaScript running in a browser, and most AI agents never execute JavaScript.
Clickport tracks AI agents as a first-class part of your analytics: which engines read your site, which pages they pulled, which visits they referred, and which of those visits converted. Every agent is verified against published IP ranges and cryptographic signatures before it's counted, so a scraper wearing a Googlebot costume doesn't make it into the report. And because agents skip the tracker, lightweight server-side connectors pick them up where JavaScript can't. I wrote up what we found when we turned this on.
Copy detection
When someone selects and copies text off your page, that's one of the strongest signals you'll get that the content mattered. They found something worth saving, quoting, or sending to a friend. Clickport records it for you: what was copied, from which page, in which session. You can filter sessions by "Signals" to pull up your most engaged visitors in one move.
No other analytics tool tracks this. Not GA4. Not Plausible. Not Fathom. Not Matomo.
Engagement score (0-100)
GA4 has an "engagement rate" that tells you one thing: was the session engaged or not. Yes or no. A session counts as engaged if it ran 10 seconds or longer, had 2 or more page views, or fired a conversion. So a visitor who reads your whole blog post in 9 seconds? Counted as not engaged.
Clickport gives every page and every source a continuous engagement score from 0 to 100, built from scroll depth and time on page. It's color-coded: green at 65 and up, amber from 35 to 64, red below 35. One look tells you which sources send people who read, not just people who scraped past some arbitrary line.
Weekday-aware comparisons
GA4 compares today to yesterday, or this week to last week. So your Monday gets measured against a Sunday. Your Saturday gets measured against a Friday. Every comparison carries the noise of the weekly rhythm baked right in.
Clickport compares against the average of the last 4 matching weekdays. A Monday goes up against earlier Mondays. A Saturday against earlier Saturdays. So when the KPI says "visitors are up 12%," it means visitors are up, not just that a busy weekday landed next to a quiet weekend.
Redesigned bounce rate
GA4's bounce rate is just engagement rate flipped over. A session is a bounce if it wasn't "engaged": under 10 seconds, one page, no conversion. By that rule, the person who reads your whole post in 9 seconds is a bounce. So is the person who scrolls to the bottom, clicks nothing, and leaves perfectly happy.
Clickport asks for all four before it calls a session a bounce: a single pageview, no clicks, less than 25% scroll depth, and under 15 seconds on the page. A reader who scrolls through your entire article without clicking? Not a bounce. That tends to land bounce rates 20-40% lower than GA4's, and closer to the truth.
Session drill-down
GA4 has a "User Explorer" buried deep in the Explore section. To use it you build a custom exploration, pick dimensions, and learn the event model first.
Clickport's Sessions panel lays out a visitor's whole journey on one screen: pages visited, clicks made, forms submitted, goals triggered. Filter by "Converted," "Bounced," or "Signals" to land on exactly the sessions you came for. Two clicks from the dashboard.
Frustration signals
GA4 tells you what happened. It stays quiet about what almost happened. Clickport tags sessions with six signals: rage clicks (someone hammering an element that won't respond), dead clicks (clicking something that looks interactive but isn't), form abandonment (started typing, never submitted), script errors (a JavaScript error fired mid-session), plus the copy detection above and print tracking.
Filter your sessions by any of these and you have a to-fix list instead of a chart. GA4 has no equivalent. The usual workaround is bolting on a separate session-replay tool and cross-referencing the two by hand.
Every site on one screen
If you run more than one site, GA4 makes you hop between properties one at a time. The one feature that merges them, roll-up reporting, is available only in Google Analytics 360, the paid enterprise tier.
Clickport's sites overview puts your whole portfolio on one screen: visitors, trends, and live counts for every site side by side. And when you want the full picture as one dashboard, a consolidated view merges your sites' traffic into a single set of panels. No enterprise contract involved.
Feature by feature
Here's what changes if you switch. The good and the bad, no spin.
Cross-device tracking
Google Ads integration
BigQuery raw export
Exploration reports
Enhanced e-commerce depth
Free tier at any scale
No consent banner needed
67x lighter script
Instant real-time data
No data sampling
Unlimited retention
EU data residency
Copy detection
Engagement score (0-100)
Weekday-aware comparisons
Smarter bounce rate
Session journey drill-down
One-page dashboard
Zero learning curve
Traffic source breakdown
UTM campaign tracking
Country / region / city
Device / browser / OS
Goal and conversion tracking
Custom event tracking
Outbound link tracking
Form submission tracking
404 error detection
Entry and exit pages
Scroll depth tracking
Time on page
PDF and CSV export
The "you lose" column is real. Cross-device tracking, Google Ads audience export, predictive audiences: those are genuine capabilities, not marketing words. If your business runs on them, that's a fair reason to stay on GA4.
But read the "same" column again. If it already covers everything you open GA4 to see, and the "you gain" column is full of things you didn't know you could have, then the complexity you've been paying for was buying you nothing.
Who should stay with GA4
I'd rather lose a sale to honesty than win one by leaving something out. So here's who should stay on GA4:
You spend serious money on Google Ads. The GA4-to-Google Ads pipeline for remarketing audiences and conversion attribution is proprietary, and nobody else can rebuild it. If paid acquisition through Google drives your revenue, that tight link earns its complexity.
You need cross-device user tracking. If you have to know that the same person browsed on mobile and converted on desktop later, you need persistent user IDs. Privacy-first tools won't do that, by design and on purpose.
You have a real analytics team. If you employ data analysts who build custom explorations, run cohort analyses, and push to BigQuery for SQL queries, GA4's depth pays off. For them the complexity is the point.
You need deep e-commerce tracking. Product-level impressions, checkout step analysis, promotion attribution, refund tracking down to the SKU: that goes past what Clickport or any privacy-focused tool offers.
Your audience doesn't block GA. If your visitors aren't tech-savvy and you operate outside the EU, with no consent banner, GA4's accuracy gap shrinks. You'll still lose some traffic to ad blockers, but less of it.
If none of those is you, then you're driving a semi truck to pick up groceries.
Companies that already switched
This isn't a thought experiment. Companies you've heard of have already moved.
Laravel pulled Google Analytics off all its properties in August 2022, pointing to a better dashboard and GDPR compliance in the tool it moved to. Basecamp, the team behind HEY.com, switched to privacy-first analytics. elementary OS ran both tools side by side for a month, then left GA for good. The European Commission picked privacy-first analytics for its Europa Analytics platform. The United Nations uses privacy-respecting tools too.
And developers keep reporting the same things after they switch. One found 24% of visitors were blocking Google Analytics yet showing up fine in the new tool. Another's Lighthouse score climbed 8 points once GA was gone. A third realized they'd been using under 10% of GA's features all along.
As Joel Gascoigne, CEO of Buffer, put it: "What a breath of fresh air. It really gives you all the traffic metrics you could need."
The story rhymes every time. Simpler tool, more accurate data, faster site, less legal risk, and the quiet realization that the complexity they'd been paying for was never doing anything for them.
Making the switch
Moving from GA4 to Clickport takes about five minutes. The hardest part is deciding to do it.
No Google Tag Manager to wrangle. No custom dimensions to register. No consent mode to wire up. No event parameters to map. One script. Full data. Right away.
If you have goals to track, things like signups, purchases, clicks, or form submissions, you set each one up in the Clickport dashboard in about a minute. No developer needed.
Keep GA4 running next to Clickport for as long as you like, to compare them yourself. Almost everyone who does this lands on the same finding. Clickport shows more visitors, because it's counting the ones GA4 never saw. (Want the wider view? Our GA alternatives comparison covers Plausible, Fathom, Matomo, and 12 more.)
See what your analytics have been hiding
Every day you run GA4, somewhere between 15% and 50% of your real visitors never show up. Your conversion rates read too high. Your source attribution is bent. Your pages load slower. And you pay thousands a year in hidden costs for that. The free tool turned out to be the expensive one.
Clickport shows you everyone. One clean dashboard. One lightweight script. Real-time data. No cookies. No consent banners. No complexity. EU-hosted, with unlimited data retention. Plus the things GA4 can't do at all: engagement scores, copy detection, weekday-aware comparisons, and a bounce rate that makes sense.
Start your 30-day free trial. No credit card. No cookie banner required.

Comments
Loading comments...
Leave a comment