How to Switch from GA4 to Clickport Analytics
Switching analytics is supposed to be painful. You picture a migration project and a dashboard that shows fewer numbers than the one you left. That's not what happens here. Move from GA4 to Clickport and you'll typically see more visitors, not fewer, because Clickport captures the traffic GA4's consent banner and ad blockers were quietly dropping. The switch takes one sitting. By the end of this guide you'll know where every report, metric, and workflow landed. (Still evaluating? Our comparison of 15+ GA alternatives covers the full landscape.)
Obvious disclosure before we start: Clickport is my product, so I'm not neutral here. What I can be is specific. I'll show you where every GA4 report lands, and I'd rather you run both tools side by side than take my word for anything.
- Setup takes about 15 minutes: one script tag, no Tag Manager, no consent mode. Data shows up in real time, and you'll see yourself as a live visitor within seconds.
- Every GA4 report has a Clickport home: sources, campaigns, pages, goals, countries, devices, and realtime, all on one dashboard with 16 built-in channels including AI Search.
- Your UTM links work unchanged. Google Ads conversions keep working too: the standalone Google Ads tag doesn't need GA4 at all.
- Run both tools side by side for 2 to 4 weeks before removing GA4. Expect 10 to 40% more visitors in Clickport; that's the traffic your consent banner was dropping.
- After the switch you can often remove the cookie banner and the 134 KB of GA4 and GTM JavaScript. Historical GA4 data stays in your Google account; export it if you want to keep it.
GA4 and Clickport approach analytics differently
The two tools won't ever show the same data. They're measuring different things in different ways. Once you see how, the gap stops looking like a problem and starts looking useful.
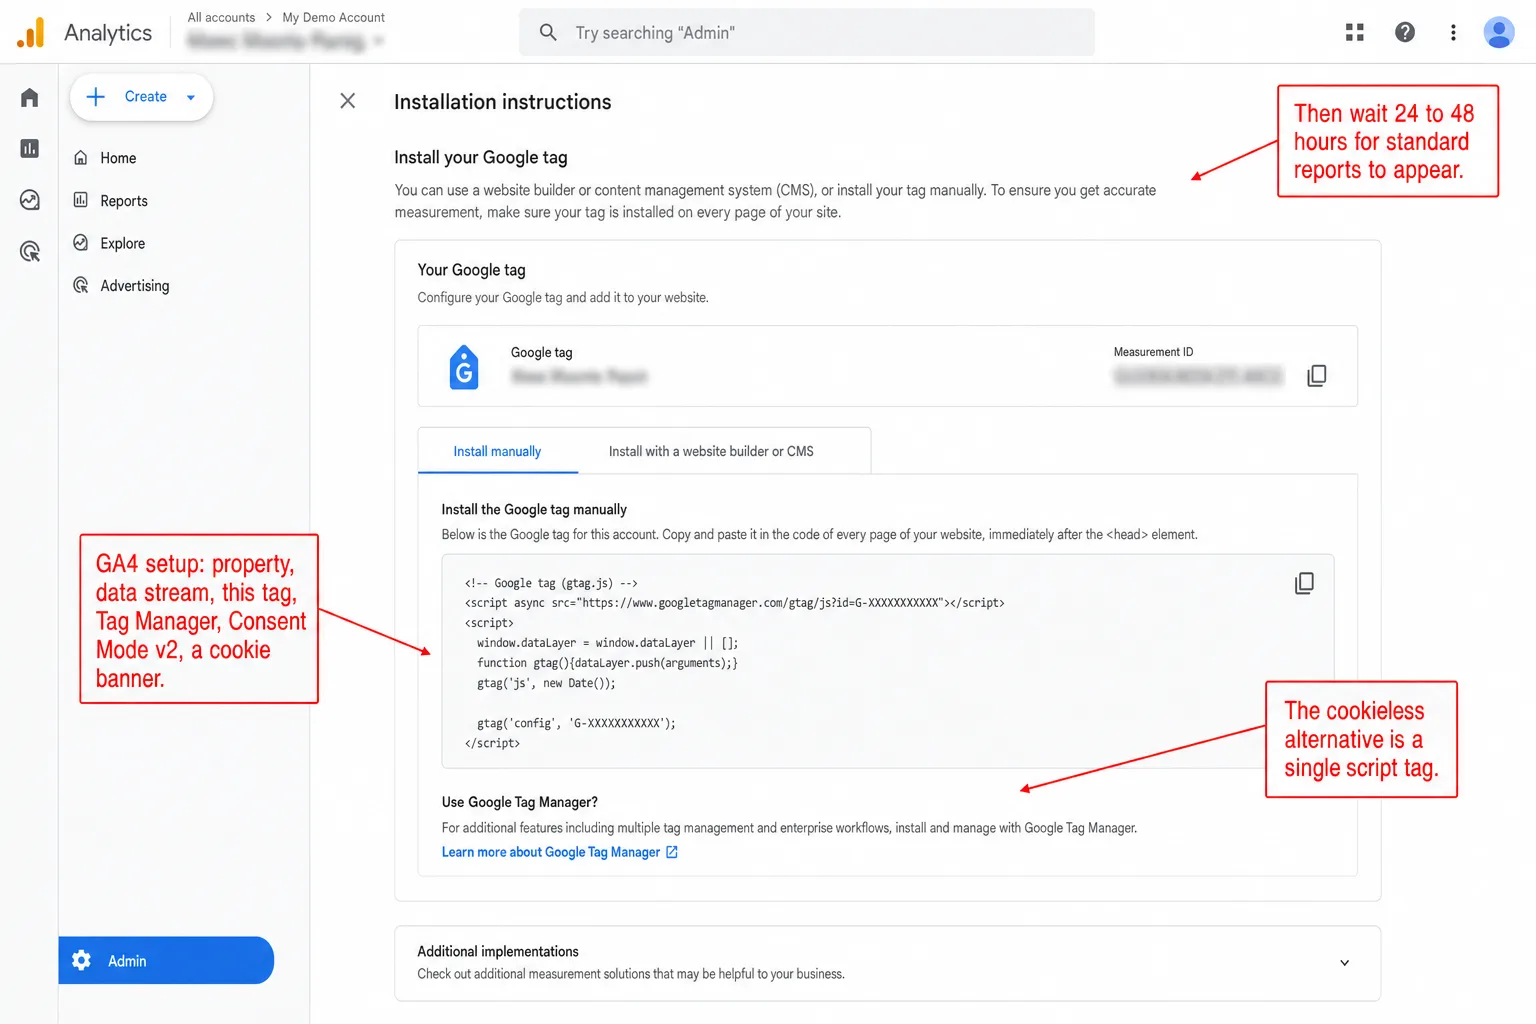
GA4 is event-based and runs on cookies. It tags returning users with a client ID, stores it in a first-party cookie, and stitches their visits together over time. In the EU that needs consent, and GA4 may not even be legal in several countries, so a slice of your visitors are never counted at all. The rest get run through machine learning models. Then the numbers can take 24 to 48 hours to settle. In practice, you're reading yesterday's traffic tomorrow.
Clickport is session-based and runs without cookies. Every visit stands on its own. Nothing links Tuesday's visit to Thursday's. You don't get user identity. What you'll get instead is the full session-level picture of every single visitor, with no consent banner required.
So the numbers won't match. That's not a bug. That's the point. Run both tools side by side, which I cover later in this guide, and expect Clickport to show 10 to 40% more visitors. In plain English: the gap is however much traffic your consent banner was quietly throwing away.
Getting up and running
The whole setup takes about 15 minutes. No Tag Manager. No consent mode to wire up. No event schema to define before you can see a single number.
Step 1: Create your account
Go to clickport.io/register and sign up. You add your first site during onboarding. Enter your domain, pick a timezone, and you're in. For a visual walkthrough of what to expect, see the Your First Dashboard guide.
Step 2: Add the tracking script
Clickport gives you one script tag. Drop it into your site's <head>.
<script defer data-domain="yoursite.com"
  src="https://clickport.io/tracker.js"></script>
That's it. One line. The script is under 2 KB compressed, loads asynchronously, and sets zero cookies. Translation: your pages won't feel it. For advanced options like hash-based routing or excluded paths, see the script configuration docs.
On WordPress, Shopify, or another CMS, paste this into your theme's header area. On WordPress you can use the header/footer plugin method or drop it straight into your theme's header.php. For Shopify, see the Shopify analytics guide. For SPAs like React, Vue, or Next.js, see the SPA tracking guide.
Step 3: Verify data is flowing
Open your site in a browser. Then open your Clickport dashboard. Within seconds you'll see yourself sitting there as a live, active visitor. If you don't, the troubleshooting guide walks through the usual causes.
Leave your GA4 script where it is for now. You'll run both side by side for a while before pulling GA4 out.
Traffic and engagement overview
In GA4, your traffic overview is scattered across Reports > Life cycle > Acquisition, Reports > Engagement, and a handful of other sidebar sections. For a plain question like "how many visitors did I get this week," you're several clicks and a report config deep.
In Clickport, everything sits on one dashboard. One page, every answer.
The top of the dashboard shows your KPIs: visitors, visits, pageviews, bounce rate, average visit duration, and engagement score. Each one shows the current value plus a comparison against the previous period. The comparison is the bit I think most tools get wrong. Clickport uses weekday-aware comparisons, so it lines up this Monday against the average of the previous four Mondays, not against Sunday. That strips out the weekday-to-weekend swings that make GA4's plain period-over-period numbers misleading.
Below the KPIs sits a time-series chart of your traffic trend for the date range you picked. Anything from Today to the last 12 months, or a custom range you set yourself.
Metrics mapping:
- GA4 "Users" = Clickport "Visitors" (unique visitors in the period). The full metrics glossary has every definition.
- GA4 "Sessions" = Clickport "Visits"
- GA4 "Views" = Clickport "Pageviews"
- GA4 "Bounce rate" = Clickport "Bounce rate", but defined differently. GA4 calls any "engaged session" a non-bounce. Clickport asks for more proof: at least two of multiple pageviews, a click, 25%+ scroll, or 15+ seconds on the page. In plain English: no proof, no engaged visit.
- GA4 "Average engagement time" = Clickport "Avg. visit duration"
- GA4 has no equivalent = Clickport "Engagement score", a 0 to 100 score that rolls up scroll depth, time, clicks, and pages viewed into one number. In other words: one number for how pages hold people.
Sources, campaigns, and UTM tracking
Traffic sources
In GA4, traffic sources live under Acquisition > Traffic acquisition, alongside a separate User acquisition report and a Channels tab you have to configure first.
In Clickport, click the Sources panel on your dashboard. Every referral source, ranked by visitors. Click one and the whole dashboard filters to it. KPIs, pages, countries, every other panel redraws to show only traffic from that source.
Clickport sorts traffic into 16 channels out of the box: Organic Search, Paid Search, Social, Email, Referral, Direct, and AI Search (ChatGPT, Perplexity, Claude, Gemini). GA4 has no AI Search channel by default. Traffic from ChatGPT, Perplexity, and the rest gets dumped into Referral or Direct unless you build custom channel groups by hand. Clickport already knows what it is.
Campaign tracking with UTM parameters
Your existing UTM-tagged URLs work with Clickport as they are. No edits. If your campaigns already carry utm_source, utm_medium, utm_campaign, utm_content, and utm_term, Clickport reads all five and shows them.
Click the Campaigns panel to see every UTM campaign. Click any one to filter the dashboard by it.
https://yoursite.com/landing?utm_source=google&utm_medium=cpc&utm_campaign=spring_sale
That URL reads the same in GA4 and in Clickport. Nothing to change.
Google Ads tracking
This is the question I get asked most. Can you track Google Ads without GA4?
Yes. Google Ads has its own conversion tracking, and it doesn't lean on GA4 at all. Two ways to do it.
Option A: Google Ads conversion tag. In your Google Ads account, go to Goals > Conversions > Summary > Create conversion action > Website. Google hands you a conversion tag to drop on your thank-you page. It records conversions straight into Google Ads, no analytics tool in the loop.
Option B: GCLID tracking. Click an ad and Google tacks a gclid parameter onto the URL. Clickport keeps that parameter in its campaign tracking. So your Google Ads traffic shows up in the Sources panel under "Paid Search" and in the Campaigns panel under the campaign UTM.
The one thing you give up is GA4's audience sharing, the feature that pushes analytics audiences into Google Ads for retargeting. But Google Ads has its own remarketing tag and Customer Match lists, and they work without any analytics tool behind them. For most businesses that's enough. The full comparison walks through the trade-off in full.
Goals, conversions, and custom events
In GA4, you flag events as "Key events", which used to be called "conversions". Anything past the default events drags in Google Tag Manager, custom event parameters, and sometimes data layer wiring on top.
In Clickport, conversions are called Goals. You build them in Settings > Goals. Four types to choose from.
Pageview goals
Track when someone lands on a specific page. Type a URL condition like "URL contains /thank-you" or "URL equals /pricing." No code to touch.
GA4 equivalent: Build a custom event in GTM that fires on that page, then flag it as a Key event.
Click goals
Track when someone clicks an outbound link that matches a condition. Say, "Click URL contains stripe.com/checkout."
GA4 equivalent: Enhanced measurement does catch outbound clicks. But you can't put conditions on them without GTM.
Form submission goals
Clickport spots form submissions on your site with no setup. You can then make a goal that matches specific forms by URL or form action.
GA4 equivalent: Enhanced measurement has basic form tracking, but it's flaky. Most GA4 setups fall back to GTM with custom triggers. I wrote a detailed guide on form tracking without GA4 if you want the full version.
Custom event goals
For anything else, use the JavaScript API. One line covers it.
clickport.track('Signup', { plan: 'pro' }, { revenue: 29.00, currency: 'USD' });
That fires a custom event with properties and, if you want, revenue data. Add a matching goal in Settings > Goals and you've got conversion rates.
GA4 equivalent: gtag('event', 'sign_up', { method: 'email' }) or a GTM custom event tag. But GA4 makes you register custom dimensions in the admin panel before they ever show up in a report. Clickport doesn't. The properties just appear.
The Goals documentation and Custom Events documentation have the full setup details.
Pages, outbound links, and downloads
Pages panel
In GA4, your top pages hide behind Reports > Engagement > Pages and screens, and then you have to switch the primary dimension from "Page title" to "Page path", which for some reason isn't the default.
In Clickport, click the Pages panel. Every page, ranked by visitors, with pageviews, bounce rate, average time on page, and engagement score. Entry pages and exit pages each get their own sub-tab.
Click any page and the whole dashboard narrows to it. KPIs, sources, countries, everything else now shows that page alone. The cross-filtering runs across every panel. Click a source, then a page, and you're looking at "visitors from Google who landed on /pricing." Click a second page and Clickport stacks it as a multi-value filter, so you can hold a few pages up next to each other ("Page is /pricing, /docs, /signup") without rebuilding anything. GA4 can do this too, through Explorations, but you'll spend a few minutes configuring it every single time.
Outbound link tracking
GA4's enhanced measurement does track outbound clicks, but the data lands in an "events" report you then have to filter by event name. In Clickport, the Outbound panel lists every external link your visitors clicked, ranked by clicks. Nothing to set up.
File downloads
Clickport tracks clicks on links to common file types by default: .pdf, .zip, .xlsx, .docx, .csv, and more. They show up as events, and you can use them as goal conditions.
404 detection
Clickport notices when a page returns a 404 and logs it. You can see which broken URLs visitors are hitting and where they came from. To track 404s in GA4 you have to build a custom event and a GTM trigger first.
Search terms
If your site has an internal search that runs on a ?q= or ?s= parameter, Clickport captures those search terms with no extra config. GA4 makes you set up the "view_search_results" event and name your query parameter in the data stream settings.
Audience: countries, devices, and browsers
Countries panel
In GA4: Reports > User > Demographics > Demographic details, then switch the dimension to "Country." In Clickport: click the Countries panel. That's the whole journey.
Click any country to drop into its regions, then its cities. The map view paints visitor distribution as a choropleth. All of it filters the rest of the dashboard, same as every other panel.
Technology panel
GA4 splits device data in two: Reports > Tech > Tech details for browsers, and a separate overview for device categories.
Clickport keeps it all in the Technology panel, with sub-tabs for Browsers, Operating Systems, and Screen Sizes. Click any row to filter.
Engagement: scroll depth, time on page, and copy detection
This is where I get to show off a little. Clickport tracks things GA4 either can't do at all or makes you set up by hand.
Scroll depth
Clickport measures how far down each page every visitor scrolls, with no setup from you. The Sessions panel shows per-session scroll depth, and the engagement score folds it in. If you want the case for why engagement beats pageviews, Beyond Pageviews makes it.
GA4 comparison: GA4's built-in scroll tracking fires once, at 90% depth. In other words: one threshold, ever. Want to know who hit 25%, 50%, or 75%? You'll be building a custom GTM trigger with a scroll depth variable.
Time on page
Clickport measures active time on page using visibility detection. Switch to another tab and the timer pauses. So what you get is real engaged time, not "time between pageviews", which is what most tools really hand you instead.
Copy detection
Clickport spots when a visitor selects and copies text on your pages. That tells you which content people found worth saving. No other mainstream analytics tool tracks it.
Form field tracking
It goes past plain submission detection. Clickport tracks which form fields visitors touch. So you'll see people start a form and then walk away at one particular field.
Real-time and reporting
Real-time view
GA4 has a real-time report covering the last 30 minutes. Clickport's works the same: a 30-minute rolling window, refreshing every 30 seconds. Put another way: same window, but this one obeys your filters. Click any source, page, or country in real time and the rest of the dashboard moves with you. There's more on how Clickport works if you want it.
PDF and CSV reports
GA4 has a basic PDF export under Share > Download File, but it only gives you whatever report you happen to be on, with no branding and no say over the layout. Clickport builds a 3-page PDF report in one click: KPI summary, traffic trends, top sources, top pages, and geography. There's a CSV export too, a ZIP with 10+ CSV files, one for every panel. If you run sites for clients, the 60-second client report guide shows the workflow.
Annotations
You can pin an annotation to any date on the Clickport dashboard to mark a launch, a campaign, or a site change. GA4 dropped annotations when it sunset Universal Analytics and didn't bring them back until March 2025. Which means nearly two years without a way to mark a launch on a chart.
Running both tools side by side
Don't rip out GA4 on day one. Run both scripts in parallel for 2 to 4 weeks first. It's the only honest way I know to trust the new numbers. Here's what to look at.
What to compare
- Visitor counts: Clickport will likely show more. That gap is the traffic GA4 lost to your consent banner and to ad blockers. Run the GA4 Data Loss Estimator first so the size of the gap doesn't surprise you.
- Top pages: The order should be about the same. A page that's #1 in GA4 shouldn't be far from the top in Clickport.
- Traffic sources: The mix should look similar, though Clickport may show more Direct. Visitors GA4 never saw, because they rejected its banner, land in Direct here.
- Geographic distribution: Same shape, but with more EU visitors in Clickport. A lot of them turned GA4's banner down.
What not to compare
- Bounce rate: The two define it differently, so they won't match. Don't expect them to. What is bounce rate has the full breakdown.
- Returning visitors: GA4 tracks these with cookies. Clickport has no cookies, so it has no such metric. It won't be there to compare.
- Engagement time: Both measure it differently. Watch the trend, not the absolute number.
When to feel confident
After 2 to 4 weeks, you're looking for four things.
- Clickport captures as much traffic as GA4, or more
- Your top pages and sources show the same patterns
- Your goals fire correctly (test every one)
- Your team can find what they need on the dashboard
If all four hold up, GA4 can go.
Removing GA4 and updating your privacy policy
Step 1: Remove the GA4 script
Delete the Google Analytics script tag from your site. If you run Google Tag Manager, pull the GA4 tag out of your GTM container. And if GTM was only ever there to feed GA4, which is common, you can drop the whole GTM container script too.
Step 2: Remove the cookie consent banner
If GA4 was the only reason you had a cookie consent banner, the banner can go too. Clickport sets no cookies, stores no personal data, and needs no consent under GDPR or ePrivacy. The GDPR compliance docs spell it out, and the wider legal backdrop for GA4 in Europe is in is Google Analytics legal.
First, check whether anything else on your site sets cookies: live chat widgets, marketing pixels, embedded videos that track. If Clickport is your only analytics tool and nothing else drops a cookie, the banner can come down.
Step 3: Update your privacy policy
Swap out the Google Analytics section in your privacy policy. Cut the references to:
- Google Analytics cookies (
_ga,_ga_*,_gid) - Data sharing with Google
- Google's data processing terms
- Consent Mode
Then add a section on Clickport. I wrote the Clickport privacy overview so you can lift the wording straight from it. The points to make: no cookies, no personal data collected, data stored in the EU, nothing shared with third parties.
Step 4: Clean up Google Tag Manager (optional)
If you're pulling GTM out for good, delete:
- The GTM container snippet from your site's
<head>and<body> - Any consent management platform (CMP) scripts that were only there for GA4
- The GTM account itself, or archive the container
That clears the 134 KB+ of JavaScript GA4 and GTM were loading on every page. In plain English: your site just got faster. The full comparison has the full breakdown of how much GA4 slows a page down.
What about your historical GA4 data?
I'll be straight about the one real gap: Clickport doesn't import from GA4. Your old GA4 data stays put in your Google Analytics account for as long as Google holds onto it: up to 14 months for Explorations if you raised the default from 2 months, and indefinitely for standard reports. In plain English: reports stay, raw events age out.
If you want to keep that data for the long haul, I'd export it before you delete the property.
- Standard reports: Pull summary data into spreadsheets with Looker Studio or the GA4 API.
- Raw data: If you turned on BigQuery export, your raw event data already lives in BigQuery, and removing GA4 won't touch it.
- Screenshots: For a quick keepsake, screenshot the reports for the periods that matter.
There's no rush. Your GA4 property keeps holding its data even after you strip the tracking script off your site. All it stops doing is collecting new data.
Start your transition
The whole thing, start to finish.
- Create a Clickport account (30-day free trial, no credit card)
- Add one script tag to your site
- Set up your goals to match your current GA4 conversions
- Run both tools for 2 to 4 weeks
- Compare the data and confirm everything you need is there
- Remove GA4, update your privacy policy, and drop your cookie banner if you can
If something unexpected comes up along the way, the documentation covers every feature in detail, or you can reach out directly. There's also a Clickport Chrome extension that shows real-time stats for any page you visit.
And if you hit a step this guide doesn't cover, email me what you're seeing. I answer every email.
And if you want the fair version, the one where I lay out what GA4 still does better as well as the trade-offs in between, read the Clickport vs Google Analytics comparison. Switching analytics was never the painful part. Staying on a tool that drops a chunk of your visitors is.

Comments
Loading comments...
Leave a comment