Sometimes the best thing your analytics can do is be seen. The new embed widget puts a live stat from your dashboard on your own website: a visitor badge in the footer, a live counter in the sidebar, or a small traffic card for your sponsor page. Pick a style, a metric, and your own wording, paste one snippet, and the number stays current on its own.
monthly visitors
12,431
powered by Clickport
The badge carries a small verification link. If your dashboard has a public share link, it points there, so sponsors and advertisers can click through and confirm your numbers against the live data. Only the one number you pick is ever public. You will find it under your site's Sharing settings. Read how it works.
July 22, 2026
Make your dashboard public, if you want to
Your stats are private by default and stay that way. But if you want the world to see them, there is now a toggle for it: flip Public dashboard in your site's Share links settings and your stats get a public URL anyone can open. Read-only, no account needed.
clickport.io/share/acme.com
Clickportaacme.comRead-onlyENG54%
Visitors
4.2k12%
Pageviews
11.1k8%
Views/Visit
2.623%
Bounce
41%5%
Handy when sponsors ask about your real reader numbers, when a buyer wants proof of traffic, or when you simply like building in public. Your revenue never appears on the public view, and your account, billing, and other sites stay invisible. Read how it works.
July 21, 2026
Paddle payments in your dashboard, and a new home for revenue
Sell through Paddle? Connect it to Clickport with a single API key and every payment shows up next to your traffic, attributed to the visit that made it. You see which channels and campaigns actually bring paying customers, refunds subtract themselves automatically, and subscription renewals are counted honestly. It works just like the Stripe connection, and both can run side by side. Here is how to set it up.
Revenue also got a better seat. It now lives in the dashboard header, right next to Engagement, always in view whatever else you are looking at. Click it and a green revenue line draws over your traffic chart, so you can see visits and money move together. Your KPI row keeps all its usual numbers.
REV€3,842ENG54%
One more thing for anyone selling in several currencies: pick a reporting currency in Settings and all revenue is shown as one number, converted at the official daily exchange rate of each payment's date. The amounts your customers were charged stay untouched. Read how it works.
July 21, 2026
Custom properties: segment traffic by what you know
Your analytics tool knows countries and browsers. You know your site: which author wrote the article, which plan the signup picked, which calculator the visitor used. Custom properties bring that knowledge into the dashboard, and they are included on every plan.
Send a property once and it shows up in Goals → Properties within seconds, ranked by traffic. Nothing to configure first.
Works on pageviews and events alike: tag articles with their author, signups with their plan, tools with their name.
Click any value and the whole dashboard reorients around it. Combine properties in the filter editor and save the result as a segment.
Hide keys you do not care about with one click, and unhide them any time with history intact.
Switching to Clickport no longer means starting the chart from zero. Drop CSV exports from your previous analytics tool onto the new Imports & exports settings page and your old traffic history appears on the dashboard, right next to what Clickport measures.
Drop a whole export ZIP. It is unpacked right in your browser and the useful files are picked out automatically, with a preview of what will be imported before anything is written.
Imported history shows on the chart with a shaded background and marker lines at the exact days it begins and ends. Imports stop at the day Clickport started tracking your site, so nothing is ever counted twice.
Pick a date range from before your switch and the visitor numbers, channels, sources, pages, and locations all come from your imported history.
Imported data never counts toward your plan's pageview limit.
Changed your mind? One click deletes the import; the data Clickport measured itself is untouched.
Read the import guide to bring your history in. Switching tools entirely? The migration guide covers the whole move in six steps.
July 14, 2026
Notes for the team, notes for yourself
Chart annotations grew up. Every note is now either a site note the whole team sees, with the author's name on it, or a personal note that stays yours. Viewers and guests can annotate too now: their personal notes live on the chart without touching the team's timeline.
Notes appear inside the chart tooltip. Hover any annotated date and read the note right under the numbers, no pin-hunting.
Give a note a time of day and it pins to the exact hour on the Today, Yesterday, and 24h views. A 14:30 deploy lines up with the 14:30 dip.
Several notes on one date collapse into a single pin with a count, and the tooltip lists them all.
Personal pins render hollow, so private context never reads as team-wide.
Mon, 14 Jul
VISITORS2,431
Maya Lindholm · 14:30
Checkout deploy
New payment provider live. Watching conversion rate.
AI assistants and crawlers read your site without loading the tracking script, so no analytics ever saw them. Clickport now tracks them server-side and shows them next to your human traffic: which engines read your pages, which cite them in live answers, and which send you visitors that convert.
Sources → AI shows every engine as a funnel: Ingested, Cited, Visited, Converted.
Pages → AI shows what AI reads next to what humans read, page by page, with a per-engine split.
Put any engine's reads on the main chart, right next to your visitors.
Every hit is verified against the operator's published IP ranges. A scraper pretending to be a known bot never reaches your numbers.
Agent hits never count toward your pageview quota.
3123 citations · 1906 crawls · 6 AI visits
Engine
Ingested
Cited ↓
Visited
Conv.
OpenAI0289830
Anthropic7618920
Perplexity2142900
Google78600
Setup takes about five minutes: create a key in Settings → Integrations → AI Agents, then connect with the Cloudflare Worker, the WordPress plugin, or from any server. The guide walks through all three.
July 11, 2026
Bring your whole team in
The new People section in Settings shares your analytics with the humans who need it. Type an email address, pick a role, done: access is active immediately. Teammates who already use Clickport see your sites on their next visit; new people get one email, set a password on a single screen, and land straight in your dashboard.
Roles keep the right doors open: owners and admins manage the team, editors change goals and site settings, viewers get read-only dashboards. Clients can join as guests on exactly one site, and a guest can even be limited to a saved segment, so an agency client sees only their own campaign traffic. Every change is recorded in a team activity trail with the person's name on it. Available on every paid plan. Read how it works.
PeopleMy Sites
Mira mira@marlow.storeAdmin
Jonas jonas@marlow.storeViewer
client@atelier-nord.de Guest, one site, segment-limitedGuest viewer
July 11, 2026
All your sites in one dashboard
Accounts with more than one site now get an All sites view: one dashboard that aggregates traffic across everything you track. One chart, one KPI row, and the full set of traffic panels, from sources and locations to pages and campaigns, with realtime and cross-filtering working exactly as on a single site. You will find it pinned to the top of the site switcher, and as a combined card leading your sites overview.
The visitor number is deduplicated, not just added up: someone who visits two of your sites on the same day counts as one visitor. The view appears on its own once your account has two or more sites and keeps itself current as sites come and go. Per-site tools like goals and session drill-downs stay on the individual sites. Read how it works.
All sites124,812
Mmarlow.store72,318
Tterra-outdoor.com51,204
Aatelier-nord.de1,290
July 6, 2026
Watch any visit play back, second by second
Open a session and every page now unfolds on a timeline. The green stretches are time spent reading, the gaps are the tab sitting in the background, and every copy, dead click, and conversion lands on the exact second it happened. You see the shape of a real visit: where someone lingered on a product, where they left to compare, and the moment they came back and bought.
It is rebuilt from the events already on your site, so it fills in on every past visit the moment you open one, with nothing to install. No screen recording, no replay, no cookies. The insight of watching someone shop, without watching anyone. See how it works.
PagesSessionsGoalsJourneys
AllLiveConvertedBouncedSignals
3.6. 14:22 - 14:41Google · United States · Desktop · macOS · Chrome
/products/terra-trail-gtxC
Copied Text:
“Terra Trail GTX, GORE-TEX”
4:1288%
C
Copied Text:
“Terra Trail GTX, GORE-TEX”
/cart1
Added to cart
Terra Trail GTX · size 43
0:52100%
1
Added to cart
Terra Trail GTX · size 43
/checkout2
Purchased
€189.00
1:3896%
2
Purchased
€189.00
3.6. 14:19 - 14:24Instagram · United States · Mobile · iOS · Safari
/products/summit-down-jacketC
Copied Text:
“SUMMIT15 for 15% off first order”
2:3184%
/cart0:44100%
3.6. 14:15 - 14:19Facebook · United Kingdom · Mobile · Android · Chrome
Every Monday morning, a short report lands in your inbox: visitors, pageviews, bounce, and engagement, followed by the part no dashboard glance gives you: what moved. A channel running well above your usual week, a page newly entering your top pages, conversions shifting. "Your usual week" means the same weekday-aware baseline the dashboard compares against, so a strong Saturday is measured against your Saturdays.
One email covers all your sites, with your three busiest that week in full and the rest as one-line summaries. Every number links to the exact dashboard view behind it, filters and date range applied. There are no attachments and no tracking pixels: we cannot see whether you opened it, by design. Traffic spike alerts ride along, an email within the hour when today is running at least 3x your usual. Weekly, monthly, or off per site under Site settings → Email reports, or read how it works.
marlow.store · Weekly report · Jun 29 - Jul 5
Visitors
1,204
↗ 12%
Pageviews
3,487
↗ 8%
Bounce
42%
↘ 3pts
Engagement
43%
↗ 4pts
What moved
↗/blog/analytics-guide entered your top pages at #2 (189 visitors) ↗Organic Search is 34% above your usual week (512 visitors) ↗ Conversions are 40% above your usual week (87 total) ↘Referral is 18% below your usual week (156 visitors)
July 4, 2026
Zoom into any date range by dragging the chart
Spotted something on the chart? Select it. Drag horizontally across the visitors chart and release: the selection becomes your date range, and the KPIs and every panel follow. While you drag, a live label shows the exact dates and span you are about to zoom into, and the selection snaps to whole days, weeks, or months so the range you get is exactly the one you highlighted.
The zoomed range lands in the page URL, so the browser back button returns you to where you started, and a shared link opens on the same view. It also pairs with the arrow keys: drag into one week, then step through its neighbors window by window. Read how it works.
July 3, 2026
The whole dashboard, one keystroke away
Press ⌘K and type. The command palette reaches everything you would otherwise click through: jump to any panel, set any date range, switch sites, apply a saved segment, open filters or settings, change the theme. A few letters and Enter replace a trip through the menus.
Around it, a small set of single keys: D toggles the date picker, F the filter editor, S the site switcher, and the arrow keys step the date range back and forward window by window, calendar months included. The same key that opens a surface closes it again. Press ? on the dashboard for the full list, or read how it works.
last
Date range
Last 24H
Last 7 Days
Last 28 Days
Last 91 Days
Last 12 Months
July 2, 2026
A sharper dashboard, top to bottom
The dashboard just went through its biggest visual refresh since launch. On large screens it now uses more of your display, so panels fit longer page names and more rows before anything truncates. Typography moved to a typeface built for data-dense interfaces, and every number in the product now uses fixed-width digits, so live values tick over without the layout shifting under your eyes.
The light theme was redesigned from the ground up: white panels on a soft neutral background, crisper borders, and every metric color retuned to stay readable on white. If you screenshot your dashboard for reports or share it with your team, light mode finally looks the part.
A long list of smaller refinements landed in the same pass:
Full keyboard support. Tab through tabs, rows, menus, and dialogs with a clear focus outline, and close dialogs with Escape.
Browser popups are gone. Confirmations for things like deleting a segment or disconnecting an integration now happen in proper in-app dialogs.
Consistent loading and empty states across every panel, and slim scrollbars that match your theme.
Session dates follow your language settings, number formatting is identical everywhere, and goal and signal badges got room to breathe.
Nothing to do on your side. Everything is already live for all sites, in both themes.
June 2026
11 updates
June 26, 2026
Put a value on every goal, and see what each one earns
Any goal can now carry a value. Set a fixed value right in the goal, pick Fixed value, type the amount, choose the currency, handy when every conversion is worth about the same, say a newsletter signup is worth €3. Or let the goal record the real amount of each sale when the number varies, like a checkout. Either way the Goals panel shows total revenue and the average per conversion for each goal, so you can tell the goal that drives volume from the one that drives value.
Filter to a revenue goal and every breakdown follows the money. You see revenue by channel, source, campaign, country, and landing page, alongside the conversions and conversion rate already there. Revenue and conversions both carry a period-over-period change, so a slow channel that quietly earns more stands out. It stays cookieless and same session, no consent banner, attributed inside the visit that paid. See how it works.
PagesSessionsGoalsJourneys
AllClicksPagesFormsEventsOutboundConfigure
GoalVisitors ↓ΔClicksCRRevenueΔ
NLNewsletter signup630+75%——€630 €1 avg+75%
PRViewed pricing412+27%————
▶PTProduct tabs188+100%412———
ACAdd to cart96+46%————
PUPurchase62+27%—4.1%€5,640 €91 avg+33%
▶SGSize guide24+50%48———
SUSubscription19+46%—1.3%€2,280 €120 avg+52%
MCMenu clicks12-63%————
L/order/thank-you3New5———
June 25, 2026
Stack filters to ask exactly the question you mean
Filters used to allow one condition per dimension. Now you can stack up to five conditions on the same dimension and combine them, so a single view can answer a precise question. Stacked rows combine with AND, several values inside one row combine with OR, and every dimension has the four operators: is, is not, contains, does not contain. So you can ask for visitors who landed on a blog post but not the draft, on mobile, from organic search, all in one filter.
The sidebar has a new Behavior group, so you filter by a goal or a signal the same way you filter by source or country. Filter to people who completed signup, or stack two goals to require both. Filter to the visitors who rage clicked, hit a dead click, or copied your text. When a completed-goal filter is on, the breakdown panels switch to conversions with a per-row conversion rate. Every filter is written into the page URL, so you can bookmark a view or share the exact link, and save the ones you return to as segments. See how it works.
FilterLearn moreExport PDFExport CSV×
URL
Page2
Entry page
Exit page
Outbound link
Behavior
Goal1
Signal
Acquisition
Channel
Source1
Campaign
▸UTM tags
Referrer URL
Location
Continent
Country
Region
City
Active filters
Pagecontains/blog××
and
Pageis not/blog/draft××
and
Sourceisgoogle×bing××
and
Goaldid completeSignup××
+ Save as segmentClear allApply filter
June 24, 2026
Signals, now ranked by what trips people up most
Signals is now a ranked breakdown, one row per kind of friction, sorted by how often it happens. Each row shows the visitors affected and the number of events, so the thing tripping up the most people sits at the top. Expand a row to see the exact culprits underneath: the buttons being rage-clicked, the elements that look clickable but do nothing, the codes people copied. Click any row and the whole dashboard filters to those visitors, so you can see their sources, pages, devices, and individual sessions.
Three new signals join the set. Script errors catch a broken script during a real visit, storing only the file name and line, never the message. Form abandons mark visitors who engaged a form but never submitted, by form, never the values they typed. Prints count the people who hit print or save as PDF. It stays cookieless with no screen recording, no keystrokes, and no personal data, just the moment a page fought back. See how it works.
PagesSessionsGoalsFunnels
AllLiveConvertedBouncedSignals
SignalVisitorsEvents
▼CCopied412503
WELCOME20128
support@…74
▸RRage clicks86241
▸DDead clicks63158
▸FForm abandons4759
▸EScript errors3188
PPrints1922
June 23, 2026
See where visitors get stuck
The Sessions panel has a new Signals view. It surfaces the visits where someone rage-clicked, hammering the same button when nothing happened, or hit a dead click, tapping something that looks clickable but does nothing. Each one shows up right on the session line as a small badge, a red R for rage and an amber D for dead. Hover it to see the exact element, click it to jump to that spot on the page.
It is the insight you would get from a session recording, without recording anyone. No screen capture, no keystrokes, no personal data, just the moment a page fought back. See how it works.
Verify installation now recognizes Google Tag Manager setups
If you add Clickport through Google Tag Manager, the tracking snippet never shows up in your page's raw HTML. It is injected when the page loads. The Verify installation button used to miss that and could report your tracker as not found even when it was working perfectly. It now reads your published Google Tag Manager container directly, so a Tag Manager install is recognized and confirmed.
The button also gives a clearer answer overall. It tells you when your tracker is live and counting visits, when it is installed and waiting for its first visit, and it flags the rare case where a tracker looks like it was removed. Once your site has recorded any traffic, the button keeps showing it as installed rather than flipping back during a quiet spell, so you are not left second-guessing a setup that is working fine.
Site & Tracking snippetVerify installation
Detected in your Google Tag Manager container. Waiting for the first events, load a page on your site to confirm.
June 18, 2026
Every range opens at the right level of detail
Each date range now opens at a chart interval that fits its length, so you read a clean trend instead of a wall of bars or one flat line. The live views (Last 24H, Today, Yesterday) open hourly. The day and month ranges (7, 14, 28 and 91 days, plus Month to Date, Last Month, Year to Date and Last 12 Months) open daily, one point per day. The interval pills stay right there to switch to weekly or monthly whenever you want.
All Time is smarter: it reads how much history your site has and picks the interval that stays legible. Under three months it charts daily, three to twelve months weekly, and past a year it rolls up to monthly. A brand new site sees daily detail from day one, while a site with years of data opens to a clean monthly trend.
Last 24HH
TodayMinH
Last 7 DaysHD
Last 28 DaysHDW
Last 91 DaysDWM
Year to DateDWM
Last 12 MonthsDWM
All TimeDWM
All Time picks the interval
Under 3 monthsDaily
3 to 12 monthsWeekly
Over 12 monthsMonthly
Set from the date of your first recorded visit.
June 15, 2026
Choose your date range, and how it compares
Every date range now lives in one list. Month to Date, Last Month, Year to Date and Last 12 Months sit next to the day and week views, with a rolling Last 91 Days for the quarter. End-of-month pacing and year-over-year reads are a single click. Last 30 Days becomes Last 28 Days, four clean weeks, so every weekday carries the same weight when the numbers are compared.
"Custom date" grows into Customize. Open it to draw any range, set its chart interval, and choose how comparison works. Keep the smart baseline, which averages the last four matching periods and lines up weekdays for you, or switch to a straight previous period or year over year. The exact dates it compares against are shown right there.
Whatever you pick flows through the whole dashboard: the headline numbers, the chart's dashed line, and the per source, per page and per country breakdowns all read against the same baseline.
Realtime
Last 24H
TodayMinH
Yesterday
Last 7 Days
Last 14 Days
Last 28 DaysHDW
Last 91 Days
Month to Date
Last Month
Year to Date
Last 12 Months
All Time
Customize
Show comparison✓
vs avg last 4 periods
Compare
No comparison
Smart baseline
Recommended
Previous period
Year over year
Match day of week
vs avg last 4 periods 21 Apr 26 – 18 May 26
June 13, 2026
Click a goal to see exactly what converts
Click a goal in the Goals panel and the whole dashboard shows its conversion rate per source, page, device and country. That reach goes further now. Goals that bundle several events used to only expand when clicked. They activate the same per-panel conversion view as every other goal now.
A goal made of many parts can also be read as a whole. Click a goal's badge and all of its products or tracked events combine into one, so the panels rank by conversion rate across the entire goal instead of one product at a time. Click a single product or event name instead, and you drill the other way, down to that one slice.
PagesSessionsGoalsJourneys
AllClicksPagesFormsEventsOutbound
Goal
Visitors ↓
Clicks
CR
A
Wireless Earbuds Pro
140
175
13.3%
A
Portable Power Station
78
87
7.4%
A
Standing Desk Riser
60
69
5.7%
A
Robot Vacuum Max
51
59
4.9%
A
Noise-Cancel Headphones
32
36
3.1%
Goals · click the orange badge to combine every product into one goal
PagesSessionsGoalsJourneys
TopEntryExitSearch404
Page
Conversions ↓
CR
/reviews/best-earbuds
89
30.9%
/reviews/standing-desks
78
19.9%
/guides/home-backup-power
75
28.4%
/best/robot-vacuums
33
13.2%
/guides/work-from-home
22
11.1%
/
15
4.7%
Pages, now ranked by conversion rate for the combined goal
This answers the question content and affiliate sites ask most: which pages actually drive conversions. A review page converting at 30% next to a homepage at 5% shows you where your next article should point. Everything composes with your other filters, and clicking the active goal again clears it.
June 12, 2026
Click a funnel step and the whole dashboard follows
Funnels now work as filters. Click any step and the entire dashboard narrows to the visitors who reached it: their sources, locations, devices, pages and individual sessions. Click the dashed drop-off zone above a step and you see only the visitors who left right there, where they came from, and what they did instead of finishing.
Homepage → Pricing → Sign up3 steps
100%
43%
14%
Homepage
Pricing
Sign up
Click a bar to filter the whole dashboard to those visitors. Click a dashed drop-off zone to see who left there.
One click answers the questions a funnel always raises. Who abandons after seeing the price? Which channel sends the visitors who finish? Combine a step selection with any other filter, like channel or device, and keep drilling. Click the highlighted step again to clear it.
Page filters work with funnels now too. Filter the dashboard to any page and every funnel recomputes for the sessions that visited it: see how your signup funnel converts for visitors who read the FAQ first. A small note above the funnel list always tells you which filters are shaping the numbers.
We rewrote how the dashboard asks for your data and how it remembers the answers. Breakdown panels respond faster across the board, especially on long date ranges. The sessions list builds about 7x faster. Auto-discovered Flows compute about 3x faster.
The dashboard also stopped re-asking questions it already knows the answer to. Return to a date range you viewed a moment ago and it paints instantly. Switch to another site and back: instant. Finished ranges are remembered for hours, while today's numbers stay on a short leash so they're always fresh.
June 11, 2026
Pick filter values from your real data
The filter dialog shows you what you'll get before you apply anything. With is, the value dropdown now searches your full history as you type, not just the most common entries. With contains, a live preview appears under the input listing the values it would match. No more guessing how a page path was spelled.
Page contains
/blog|
3 pages match
/blog/best-analytics-tools412
/blog/cookie-banner-guide288
/blog/ga4-migration190
May 2026
22 updates
May 30, 2026
Phantom referrers, filtered before they reach your reports
Some tag and monitoring tools quietly fire your analytics during routine automated health checks, logging visits that no real person ever made. Clickport now recognises these phantom referrers and filters them out automatically, before they ever reach your reports.
Bot Center · filtered sources
uptime-monitor.example
Automated health check
Filtered
tag-checker.example
Automated health check
Filtered
There's nothing to switch on and no list to keep updated on your end. Anything filtered this way still shows up in your Bot Center alongside every other blocked source, so the cleanup stays transparent.
May 18, 2026
Journeys: discover popular paths, save the ones worth tracking
The right-side panel has a new Journeys tab with two sub-tabs. Flows (default) surfaces the top multi-step paths your visitors actually take, auto-discovered from your session data with no setup required. Funnels stays where it always was, now nested under the same parent because the two share a chart and a story. Open Journeys on any dashboard and the top paths are already ranked by session count.
Click any row to expand it into the same step-by-step bar chart Funnels uses: visitors who started on step 1, then the subset who continued to step 2, then the visitors who walked the exact path. Drop-off between steps is shown as a dashed overlay above each bar.
When a discovered path looks worth tracking on every dashboard load, click Save as funnel, name it, confirm. The new funnel appears under the Funnels sub-tab, ready to monitor across date ranges and segments. The funnel stores the pathnames directly so nothing extra appears in your goals panel. Discovery becomes ongoing measurement in one click. More in the docs →
May 15, 2026
Filter by a goal, every panel shows its conversion rate
Click any goal in the Goals panel and the whole dashboard cross-filters to that goal: the headline KPIs already did, the chart already did, and now every breakdown panel swaps its right-side columns from Visitors and Engagement to Conversions and CR. Sources, Channels, Locations sub-tabs (Continents, Countries, Regions, Cities), Technologies sub-tabs (Devices, Browsers, OS, Screen Sizes), every UTM panel, Campaigns, and Pages all participate.
Goal is Snippet ×applies to every panel below
SOURCES
SourceConversionsCR
Direct / None323.06%
producthunt.com76.19%
LinkedIn32.27%
Reddit150.0%
LOCATIONS
CountryConversionsCR
United States185.91%
Germany914.0%
United Kingdom47.55%
Netherlands28.77%
Spain16.06%
The CR per row is the share of sessions in that dimension that converted on the filtered goal, divided by the total sessions in that dimension. So 6.19% on ProductHunt means 6 out of every 100 ProductHunt visitors did the goal, not that ProductHunt is 6% of all conversions. Pick a high-CR low-volume source like Reddit at 50% and you have a hint about where to lean in; pick a high-volume low-CR source like Google at 1% and you know where the gap is.
Click off the goal filter at any time and the panels switch back to the standard Visitors and Engagement columns. More in the docs →
May 14, 2026
Spot where your funnel leaks with conversion funnels
Funnels turn your saved goals into a step-by-step drop-off chart. Where a goal answers "how many converted," a funnel shows you which step is leaking visitors on the way there. Useful for trial signup flows, checkout sequences, lead-gen forms, anything with 2 to 8 ordered steps.
Trial signup3 steps12.6%›
100%
(12,847 Visitors)
24.9%
(3,201 Visitors)
12.6%
(1,623 Visitors)
Visit /pricing
Start trial
Complete signup
Build one in Settings → Goals & Funnels → Funnels. Pick 2 to 8 of your existing goals, drag them into order, save. The chart fills in immediately against your full historical data, no "starts counting from now" caveat.
The new Funnels tab sits next to Pages, Sessions, and Goals in the right panel. Each saved funnel shows its end-to-end completion rate up front; click a row to expand the chart with per-step counts and drop-off bars. Cross-filters compose, so you can compare your signup funnel for paid traffic vs organic, German visitors vs US, mobile vs desktop.
Read the funnels docs for the full setup walkthrough, strict vs relaxed order, the 24-hour completion window, and troubleshooting.
May 14, 2026
Export your data. One button, ZIP of 17 CSVs, all-time.
Open Settings → Export data, click Prepare export, and we email you a ZIP with every metric we have for your site, aggregated by day, going back to your first pageview. Free at every tier. The link is valid for 24 hours.
Export data
Download every metric we have for this site as a ZIP of 17 CSVs.
Aggregated by day in your site timezone, all-time. We email you when
the file is ready, and the link is valid for 24 hours.
Export in progress…
Ready
Requested 12s ago, finished 4s ago
Size: 4.2 MB, expires in 23 hours
Download ZIP
Inside the ZIP: visitors.csv, sources.csv, pages.csv, entry_pages.csv, exit_pages.csv, locations.csv, devices.csv, browsers.csv, operating_systems.csv, channels.csv, custom_events.csv, custom_props.csv, outbound_links.csv, downloads.csv, not_found.csv, engagement.csv, and hourly.csv. Each one is grouped by date in your site timezone, with units encoded right in the column headers (_sec for seconds, _ms for milliseconds, _pct for percentages). A README.txt at the root spells out the manifest and the date range covered.
This is the GDPR data-portability lever made one-click. Your data is yours, no format lock-in, no extra cost. Run it once for a quarterly archive, run it whenever you switch tools, or just keep one in cold storage for peace of mind. If you need a filtered or short-range slice instead, the existing Export button in the dashboard respects your current date range and filters. Full docs →
May 14, 2026
Tracking rules. Block specific traffic from your analytics.
The Exclude my visits tab is now Tracking rules, and it has four new options on top of the personal-device toggle. You can pick which traffic to keep and which to throw away before it ever reaches your dashboard.
IP addresses0 / 100
Learn more
Drop traffic from a specific IP or a CIDR range. Useful for your office network or a known scraper.
Add
Countries0 / 250
Learn more
Drop traffic from countries that are not relevant to you. Includes anonymous proxies and VPNs.
Add
Pages0 / 100
Learn more
Skip URL paths you do not want in your numbers. Admin pages, staging routes, login flows.
Add
Hostnames0 / 50
Learn more
Pick which hostnames may use your tracker. Blocks anyone who steals your snippet onto a different domain.
Add
The four shields cover the most common reasons unwanted traffic shows up in analytics. IPs and CIDR ranges let you block your office network or a known abuse range. Countries drop traffic from regions that are not your audience, plus a special entry for anonymous proxies and VPNs. Pages remove URL paths from your reports, with wildcard support so /admin/* covers every admin route in one rule. Hostnames is the only allow list of the four: empty means anyone can use your tracker, add one entry and strict mode kicks in.
Everything happens at ingestion. Matching events return a normal 200 to the browser but never reach your data, never appear in any panel, and never count against your monthly tier. The old URL /your-domain/settings/my-visits redirects to the new /your-domain/settings/tracking-rules, so existing bookmarks and email links still land. Full overview →
Connect Bing Webmaster Tools to any of your sites from Settings → Integrations, paste an API key, pick a site, and the search queries driving Bing traffic show up in a new Bing sub-tab between GSC and URLs. Clicks, impressions, CTR, and ranking position. One paste, no OAuth, no consent screens.
The click and impression counts are Bing-specific, but Bing's index also powers DuckDuckGo, Ecosia, Yahoo, and Brave Search. The queries and ranking positions in the Bing tab therefore apply to all five engines simultaneously. For EU and DE-heavy sites where Bing-family search often outweighs Google, this is the integration that's never been available in privacy-first analytics. Read the full guide →
ChannelsSourcesGSCBingURLs
QueryClicks ↓Impr.CTRPos.
linen pillow cover queen871,8104.8%4.1
washable linen duvet621,2055.1%5.8
how to soften linen sheets482,1032.3%8.0
stonewashed linen vs cotton316404.8%6.4
linen care guide284126.8%3.3
May 13, 2026
Search keywords from Google, inside the dashboard
Connect Google Search Console to any of your sites from Settings → Integrations, pick a property, and the search queries that drive Google traffic show up in a new GSC tab right next to your other source data. Clicks, impressions, CTR, and average ranking position, all alongside the visit data you already see.
Active dashboard filters carry over to the keyword view: page, country, device. Click any column to sort, click Show More to load another fifty keywords. Switch back and forth between visit data and keyword data without leaving the page. Read the full guide →
ChannelsSourcesGSCURLs
QueryClicks ↓Impr.CTRPos.
linen pillow cover queen1422,4185.9%3.2
washable linen duvet981,6046.1%4.8
how to soften linen sheets763,1802.4%7.1
stonewashed linen vs cotton548726.2%5.6
linen care guide414988.2%2.9
May 12, 2026
Time interval pills, on every range
Every date range that has more than one sensible chart bucket now shows a small pill on its row in the date picker. Pick Min or H on Today, Yesterday, and the rolling 24-hour window. Pick H or D on Last 7 Days and Last 14 Days. Pick D or W on Last 30 Days, and add M for All Time. Hover any range to see its pill, then click the bucket you want. One click commits both the new range and the new bucket.
"Last 24 Hours" is also renamed to "Last 24H" to keep the row label tidy alongside the pill.
Last 7 Days▼
Realtime
Last 24H
TodayMinH
Yesterday
Last 7 DaysHD
Last 14 Days
Last 30 Days
All Time
Custom date
Show comparison✓
vs avg last 4 weeks
May 12, 2026
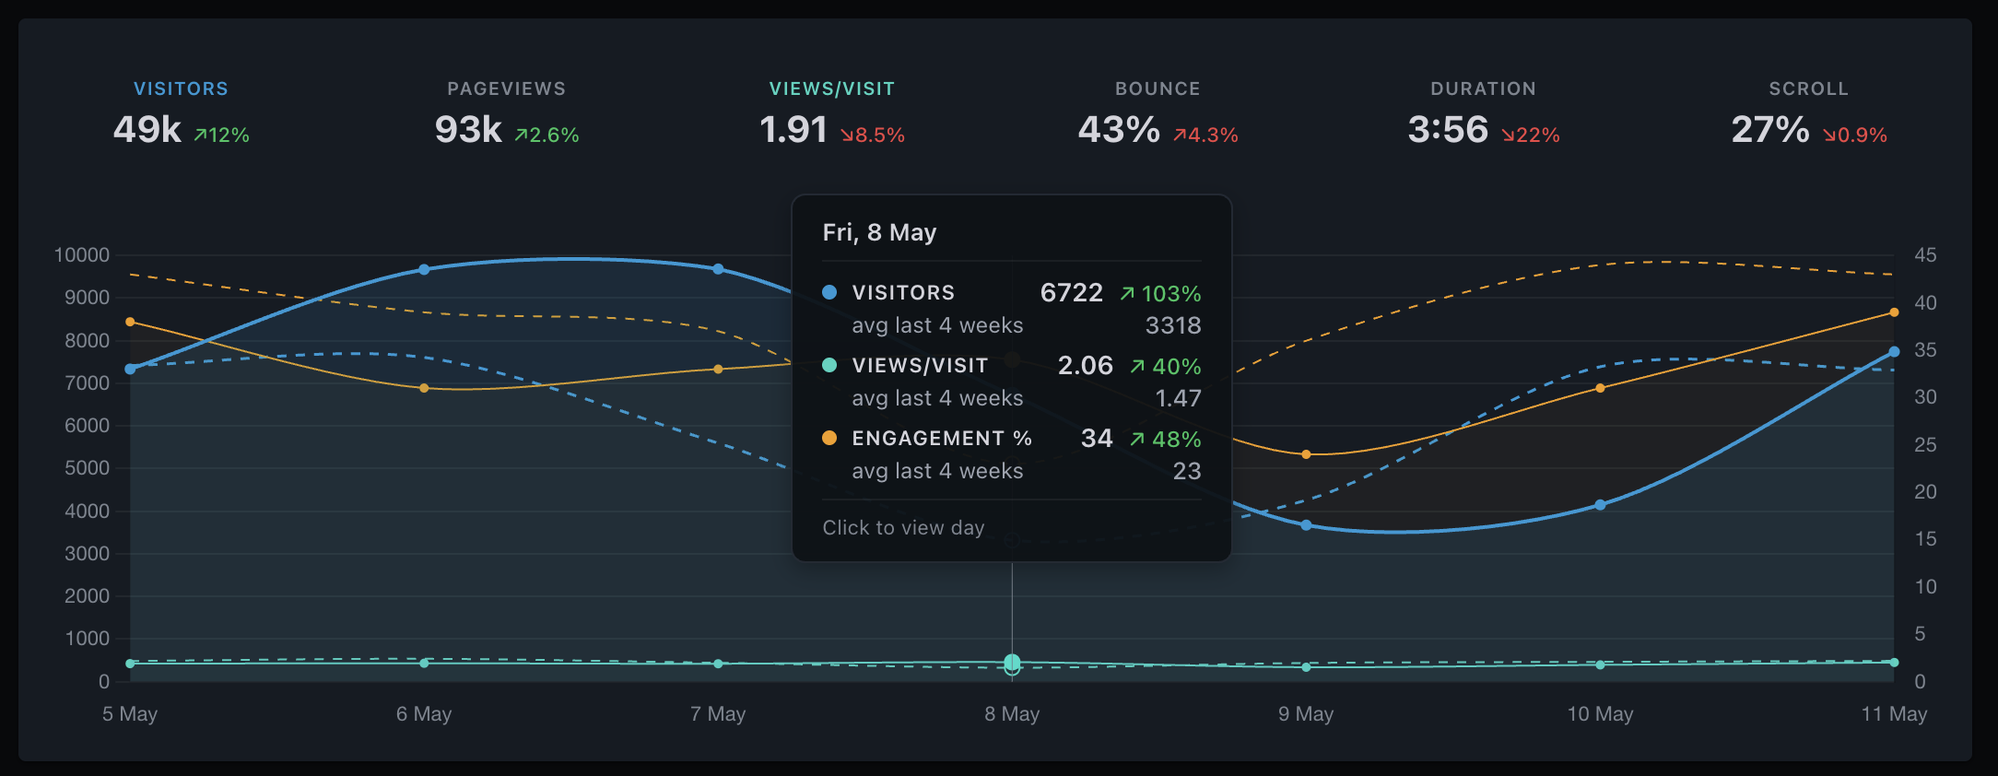
A clearer chart hover
Move your cursor across the chart and a thin vertical guide line follows it, snapping to the nearest bucket. Filled dots highlight each visible metric's value at that point, so you can read every line at once. The tooltip box anchors at the top of the chart instead of chasing the data point up and down, and the date appears once at the top of the box instead of repeating next to every metric.
For minute-level views (Today, Yesterday, and Last 24H with the Min pill), the chart switched from a wall of skinny bars to a smooth line with a filled area. Easier to read, same data underneath.
May 10, 2026
Spot new updates at a glance
When there's a new entry on this page, a red dot now appears on the cog icon at the top of your dashboard, and again on the "What's new" item inside the menu. Click through, read what's new, and your dashboard picks up the latest version when you head back. No more wondering if you're on the latest.
May 8, 2026
Filtering, redesigned
The filter modal is rebuilt around a categorised picker (URL, Acquisition, Location, Device) and an inline editor. The big new capability: one filter can hold multiple values that combine with OR. "Country is GB, US" matches both. Click two rows in any panel and Clickport merges them into the same filter instead of duplicating. Saved segments now sync to your account, so what you save on desktop shows up on mobile and vice versa.
Multi-value within one filter: stack values per dimension, combined with OR (is, contains) or AND-of-NOT (is not, does not contain)
23 dimensions organised into four categories. UTM tags and Location expand inline so you only add the specific sub-dimension you want
Saved segments synced across devices, with a one-time auto-migration of any segments stored locally before the change
Case-insensitive contains: Page contains hanta matches /Hantavirus too. Exact-match operators stay case-sensitive so URL paths still match precisely
Three new filter dimensions: Entry page, Exit page, and Outbound link
Edit any active filter inline. No mode switch, no separate dialog. Long URL chips wrap onto multiple lines instead of truncating
FilterDefine conditions to narrow your dataExport PDFExport CSV×
Another round of accuracy and quality-of-life improvements. Values across the dashboard are selectable again, the opt-out for your own visits has its own settings page, and session attribution is sharper for visitors who come back on long-lived tabs.
Copy KPI numbers, source and page names, country and city names, session details, error messages, and chart tooltips like text on any other page
"Exclude my visits" lives at /your-domain/settings/my-visits with clearer copy and a Learn more link to the docs
Visitors whose browsers restore an old tab from days ago now correctly start a fresh session today, so the "1 online" beacon and the Sessions panel filtered to today agree more reliably
May 7, 2026
Faster, smoother event ingestion
The tracker now responds a touch faster, and events flow through more reliably during traffic spikes or brief network blips. Realtime data still appears in your dashboard within seconds. It's the kind of change you only notice if it's missing.
May 6, 2026
Goals and Bot Center, on dedicated pages
Configuring Goals used to live in a cramped 500px modal, and Bot Center was a tab inside the toolbar popover. Both now have their own per-site settings pages with full breathing room: Goals at /your-domain/settings/goals, Bot Center at /your-domain/settings/bot-center. The dashboard panels deep-link straight to them, so the configure step is one click from the data.
Goals: full-width condition builder, sharable and deep-linkable URL, drag to reorder, Learn more link to the docs
Bot Center: AI crawlers grouped by intent (Live, Index, Train), blocked counts and traffic-quality breakdown, Learn more link to the docs
Dashboard Goals panel: new Configure link in the header, plus a clearer empty-state message when no goals match the date range
May 6, 2026
Two-factor authentication
Two-factor authentication is now available in account settings. Pair an authenticator app, save 10 one-time recovery codes, and every password sign-in adds a 6-digit code step. OAuth sign-ins are unaffected. Disable any time with your password.
Works with any TOTP app: 1Password, Authy, Google Authenticator, Bitwarden, Aegis
10 single-use recovery codes for when you don't have your phone, plus a banner when you're running low
Replay protection per code, plus a five-attempt lockout for failed codes
If you lose both your authenticator and your recovery codes, support clears it manually after verifying identity. There is no self-serve unlock
Account settings is now four focused pages instead of one long scroll: Subscription, Account (name + avatar), Security (email, password, connected accounts, 2FA, login management), and a Good bye page if you want to leave. Every card now has a Learn more link to a new doc that explains how it works.
Six new docs covering 2FA, change email, change password, connected accounts, login management, and account deletion
Account deletion is now a request, not a one-click destructive action: we sign you out, send a confirmation email, and process the deletion by hand within one business day so you have a chance to undo or ask questions
Each settings page has its own URL, sharable and deep-linkable
May 6, 2026
Sites overview, with live activity at a glance
Sign in and you land on a cards page showing every site you track, side by side. Each card has a 24-hour visitor count, a comparison to the day before, hourly visitor bars for the last 24 hours, and a pulsing dot when someone is on the site right now. Click a card to enter that site's dashboard, or the cog to jump straight to its settings.
Press / to search
Most visitors
Add website
mountainbrew.coffee4
1,420visitors / last 24h▲ +30%
Ppixeldraft.studio
880visitors / last 24h▲ +37%
weekendsailor.blog
510visitors / last 24h▼ -12%
lumenforge.io2
2,340visitors / last 24h▲ +52%
oakbridge.dev
1,065visitors / last 24h▲ +8%
finchmarket.com
760visitors / last 24h▲ +4%
Live visitor count pulses on every card; no need to open each site to see if anyone's online
24h trend graph plus ±% vs prior 24h, sorted busiest first by default
Search by domain (press / from anywhere), sort by name or traffic, or drag cards into a custom order
Each site now has its own settings URL: sharable, deep-linkable, kept separate from account-level settings
Visitor identification moved fully server-side, with a hashing salt that rotates every 24 hours. Once a salt is destroyed, the visitor IDs it produced can't be reproduced, even with full database access. The privacy promise was already strong; this gives it a hard mathematical guarantee.
No client-side identifier the server uses to track or group visitors
Hashing salt rotates daily and is destroyed after a 24-hour overlap window
Visitor IDs become impossible to reproduce after 48 hours, even for us
Same visitors counted the same way, dashboards and reports look identical
May 6, 2026
Polish across the dashboard
A round of accuracy and quality-of-life improvements. Bot filtering got sharper at ingestion time, with a one-time cleanup of historical bot sessions on affected accounts. We also tightened privacy in the tracker, fixed a Conversion Rate overcount, and smoothed a few corners around sign-in and the dashboard chrome.
Tighter bot filtering means cleaner bounce and engagement numbers
Tracking tokens in URLs are stripped before anything is stored
Conversion Rate KPI is more accurate
Sign-in returns you to where you came from, no flash to the add-site screen
Legal links live in the Account menu, longer session paths stay readable, monochrome icons on channel rows
May 4, 2026
Mark goals as engagement-only
Goals you don't want counted as conversions can now be flagged as engagement-only in the Goals config. They still track visitors and event counts (and properties for custom events), but won't show a conversion rate or feed the dashboard Conversion Rate KPI. Useful for soft signals like scroll depth, time on page, or video plays, where you want the data without skewing your real conversion math.
May 2, 2026
404 page tracking with session drill-down
The 404 sub-tab in the Pages panel now lists every URL on your site that returned a 404 to a real visitor, sorted by hit count. Click any row to filter the dashboard to that path, then open the Sessions tab to see exactly which sessions hit it, the in-site page they came from right before, and the rest of their journey.
Detected automatically from the page title, or via a one-line config flag in your 404 template
Updates in real time as broken links are clicked
Cross-filter pulls the 404 path into Sources, Countries, Tech, and every other panel
Session drill-down names the previous in-site page, so internal broken links are easy to track down
April 2026
6 updates
Apr 23, 2026
GA4 Data Loss Estimator: a new free tool
A new free tool at /ga4-data-loss-estimator that estimates how much traffic GA4 is missing on your site and why. Enter your monthly pageviews and industry, and it breaks the loss down into four drivers: ad blockers, consent banner refusals, Safari ITP, and GA4's own internal filtering.
Two modes: a quick estimate from a single industry, or a detailed breakdown for sites with mixed audiences
Per-industry bot traffic estimates, with sources cited inline
Separate percentages for each driver so you can see which one is hitting your site hardest
Every number links through to the methodology that produced it, so you can verify the math
Apr 23, 2026
Free UTM builder
A free UTM builder at /utm-builder. Paste a URL, fill in the campaign parameters, and copy out a properly tagged link. It also runs in reverse: paste an existing tagged URL and it parses the parameters back out.
Live channel classifier shows which channel the link will map to before you publish it
A to F hygiene score flags common problems as you type: caps, spaces, missing required fields, source and medium swapped, suspicious values
Autocomplete remembers your past sources, mediums, and campaigns
Taxonomy spec editor: define team-wide naming rules once, and the builder enforces them for everyone
25 platform presets, bulk permutations with CSV export, saved user presets, shareable URL state, QR codes, and last-10 history
100% client-side, no sign-in required, works even if you don't use Clickport
Apr 21, 2026
Dashboard polish across filters, goals, and exclusions
A handful of small but annoying issues fixed this week.
Page filter operators now behave correctly in goals, clicks, forms, and other events-based panels. Some operators previously returned misleading results.
"Does not contain" on the page filter works again, along with a 500 error when filtering on a full domain and path at the same time.
The conversions chart no longer falls back to click counts when a goal has no matching events. An empty goal now shows as empty.
The goal "Element" field is renamed to "Button/link text" so the label matches what you put in it.
Apr 15, 2026
Exclude your own visits reliably, even on mobile
The "Exclude my visits" toggle in Settings now remembers the device itself instead of its IP address. Flip it once per device and your visits stay hidden from your analytics, even when your phone switches between Wi-Fi and cellular or your home router gets a new IP. Mobile networks rotate IP addresses several times a day, so the old IP-based setting often wore off within hours. The new approach sticks until you flip it off.
One-time setup per device, per site
Survives any network or IP change on that browser
Flip it off from Settings whenever you want your visits counted again
Apr 6, 2026
Idle bot detection and geo accuracy fix
Mobile proxy bot detection
A new detection layer catches bots that use residential and mobile proxy IPs to bypass datacenter blocklists. These bots land on a page, sit idle for a few seconds without scrolling or interacting, and leave. Clickport now analyzes scroll depth, interaction signals, and behavioral scoring on page leave to identify this pattern. When a bot is confirmed, its session is retroactively cancelled so it never appears in your analytics.
More accurate country detection
Fixed a geo resolution bug that classified certain US mobile carrier IP ranges (including T-Mobile) as unknown instead of resolving them to their actual country. Visitors from these networks now show the correct location in your dashboard.
Apr 2, 2026
Advanced bot detection: fingerprint velocity and browser signals
Sophisticated scraper botnets use real browser engines and residential proxy IPs to evade traditional bot detection. Today we're shipping two new detection layers that catch them without blocking legitimate visitors.
Fingerprint velocity limiting
Botnets share a uniform technology fingerprint across hundreds of IP addresses. Clickport now tracks the combination of browser version, operating system, country, and device type in a sliding time window. When an unusual spike of identical fingerprints is detected for a single site, subsequent events from that fingerprint are blocked automatically. This catches distributed scraping operations that rotate IPs but can't rotate their browser configuration.
Tracker-side browser signals
The tracker now collects lightweight signals that distinguish real browsers from headless automation:
Software GPU detection: headless Chrome uses a software renderer (SwiftShader) instead of a real GPU. The tracker reads the WebGL renderer string and reports it to the server.
Browser language check: real browsers always report at least one language preference. Headless browsers that forget to configure this are caught instantly.
Human interaction flag: a lightweight listener detects whether any real user interaction (click, tap, keypress) occurred during the session. This signal is collected for analysis and future scoring.
These checks add less than 300 bytes to the tracker (total size remains under 2.2 KB gzipped) and run with zero performance impact.
JS execution timing
The tracker now measures how long JavaScript takes to initialize. Real browsers need at least a few milliseconds to parse, compile, and execute the tracker script. Headless automation frameworks that inject pre-compiled scripts can report an execution time of zero. Events with impossibly fast execution timing are blocked automatically.
Interaction-based detection
Sessions that scroll deeply in a short time without any human interaction (no clicks, taps, or keypresses) are a strong bot signal. When a page leave event shows 90%+ scroll depth, under 5 seconds of engagement, and zero interaction, the session is blocked. This catches content-scraping bots that simulate scroll behavior but never actually interact with the page.
Behavioral scoring
The tracker now computes a real-time behavioral score based on mouse movement variance, scroll velocity patterns, and input timing distribution. These metrics use lightweight statistical analysis (online variance, no stored arrays) to distinguish natural human behavior from robotic automation. The score is sent with engagement data for server-side evaluation.
March 2026
7 updates
Mar 29, 2026
Traffic Quality in Bot Center
The Bot Center now shows a Traffic Quality score: the percentage of sessions with zero engagement (no scroll, no clicks, no time on page). These are visitors that passed bot detection but behaved like ghosts on your site. A color-coded card turns green, yellow, or red based on thresholds.
Zero-engagement percentage with green/yellow/red health indicator
Per-device breakdown (Desktop, Mobile, Tablet) reveals which device type carries the most bot-like traffic
Expand any device to see the breakdown by screen size (XS through XXL). Bots that spoof a device type tend to cluster on a single resolution.
Built on engagement signals that only client-side analytics can capture: scroll depth, duration, and click tracking
Mar 23, 2026
Smarter comparison baselines
Comparison arrows and chart overlays now adapt to how much data your site has. New sites get reliable comparisons based on available history instead of being averaged against empty periods. The comparison label tells you exactly what you're measuring against ("vs last Monday" vs "avg last 4 Mondays").
Comparisons are filtered by your site's actual data history
30-day views now use the same multi-period averaging as 7 and 14-day views
No more misleading arrows on brand-new sites with insufficient data
Mar 15, 2026
Engagement score pill in the toolbar
A compact pill in the toolbar now shows your site-wide engagement score at a glance. Click it to toggle an engagement trend line on the main chart, so you can see how engagement moves alongside visitors, pageviews, or any other metric.
Engagement is computed from average scroll depth and time on page
The pill lights up green when the chart line is active
Works with comparison mode: a dashed line shows the previous period's engagement
Visibility is tied to the Show Engagement setting, keeping the toolbar clean if you don't need it
Mar 13, 2026
Period-over-period comparison on all panels
Enable the comparison toggle and every panel row now shows a delta column with the percentage change compared to the previous period. See at a glance which sources, countries, devices, campaigns, and pages are trending up or down. Items that are new since the last period are labeled accordingly.
The delta column is sortable, so you can quickly find your biggest movers. Comparison uses the same weekday-aware baselines as the KPI row.
Mar 13, 2026
Realtime improvements and campaign engagement
The Realtime view now uses a bar chart that makes it easier to spot traffic spikes at a glance. The x-axis shows relative time labels (-30m, -26m, ..., now) so you can instantly tell how recent each bar is without checking the clock.
The Campaigns panel now includes an Engagement column across all sub-panels (Sources, Mediums, Content, and Terms), so you can see which campaigns are driving engaged visitors, not just clicks.
Mar 12, 2026
Share links
You can now create a share link that gives anyone read-only access to your dashboard. No account required. Send the link to a client, teammate, or manager and they see the same panels, filters, and date ranges you do.
Create up to 10 share links per site from Settings
Each link is a unique, unguessable URL
Recipients see the full dashboard but cannot edit goals, annotations, or settings
Revoke any link instantly when you no longer need it
Mar 8, 2026
Sign in with Google and GitHub
Create an account or sign in with one click using your Google or GitHub account. You can connect both providers to an existing account, set a password alongside social login, or use social login exclusively. Manage connected accounts from Settings.
February 2026
11 updates
Feb 22, 2026
Chrome extension: live visitor badge
A new Chrome extension that shows a live visitor count on your browser toolbar. When visitors are active on any of your sites, a green badge appears with the total count. Click the icon to see a per-site breakdown and jump straight to any dashboard.
Polls every 30 seconds, matching the dashboard's realtime refresh
Works in all Chromium browsers (Chrome, Brave, Edge, Arc)
Available as a direct download for Clickport subscribers
Feb 22, 2026
Drag-and-drop site reorder
If you manage multiple sites, you can now drag and drop them into your preferred order in the site picker. Your custom order is saved locally and persists across sessions.
Feb 22, 2026
Hide sites from the site picker
Hover any non-active site in the site picker and click the eye icon to hide it. Hidden sites collapse into an expandable "N hidden sites" section at the bottom. Click the eye icon again to bring them back. Useful for keeping test sites or dormant projects out of the way.
Feb 21, 2026
AI Search channel and AI Crawlers
Traffic from AI search engines now gets its own channel. Referrals from ChatGPT, Perplexity, Claude, Gemini, Copilot, and others show up as "AI Search" in your Sources panel instead of being grouped with traditional search engines.
New "AI Search" channel covers 13 AI answer engines
Paid traffic from AI sources still classifies correctly (e.g. gclid + ChatGPT = Paid Search)
Bot Center now shows an "AI Crawlers" section listing which AI bots are hitting your site and how often
Feb 15, 2026
Converted sessions filter
The sessions panel now has a "Converted" tab that shows only sessions where a visitor triggered a goal conversion. Useful for understanding which traffic sources and pages drive results, not just visits.
Feb 14, 2026
WordPress connector plugin
A lightweight WordPress plugin that installs the Clickport tracker on your site with one click. No manual code editing, no theme modifications. Just activate the plugin, paste your site ID, and you're tracking.
Feb 13, 2026
Last 24H time range
You can now view a rolling 24-hour window alongside Today, Last 7 Days, Last 30 Days, and the other date ranges. The chart shows hourly granularity across the full 24-hour window, including a comparison line for the previous period.
This is useful for catching traffic spikes from social shares, newsletter sends, or campaign launches without waiting for the daily rollover.
Feb 10, 2026
Documentation
We published 14 documentation pages covering everything from installation to custom events. Every page includes visual mockups of the actual dashboard UI so you can see exactly what to expect.
What's covered
Installation, script configuration, and your first dashboard
KPIs, panels, sessions, and date ranges
Goals, custom events, engagement, outbound links, and forms
Site management, bot management, and reports
WordPress setup and SPA tracking
Privacy overview, GDPR compliance, and troubleshooting
All docs are searchable site-wide with Cmd+K (or Ctrl+K). Built with Pagefind.
Feb 7, 2026
Chart annotations
You can now mark significant dates directly on the chart. Click the annotation icon in the header, then click any point on the chart to add a note. Useful for tracking the impact of deployments, campaigns, content changes, or anything else you want to correlate with traffic.
Color picker for visual categorization
Annotations aggregate in weekly and monthly views
Click an aggregated annotation to drill down into the individual notes
Feb 4, 2026
PDF and CSV exports
Export your dashboard data as a 3-page landscape PDF report or as raw CSV files. The PDF matches the dashboard layout with KPIs, chart, and all panels. CSV exports use raw numeric values and ISO dates for easy processing in spreadsheets or scripts.
Feb 1, 2026
Performance and stability
A round of behind-the-scenes improvements to make the dashboard faster and more reliable.
66% smaller JavaScript bundle through code splitting and lazy loading
Fixed race conditions when switching between date ranges quickly
Added request cancellation so stale API calls don't overwrite fresh data
Error boundaries catch rendering failures gracefully instead of blanking the page
Fixed XSS vulnerabilities in chart tooltips and PDF export
Try Clickport for free
Have a feature request? Let us know what you'd like to see next.