What Is Bounce Rate? Your Analytics Tool Is Probably Measuring It Wrong
What is bounce rate? It's the percentage of visitors who land on your site and leave after one page, without doing anything that counts as engagement. Simple enough. The problem is that your bounce rate is probably wrong. Not "slightly off." Structurally wrong. Most analytics tools calculate it from 25-50% of your actual visitors, and the visitors they miss aren't a random sample. In plain English: the number is built on a biased fraction. Worse, three popular tools will show you three different bounce rates for the same website, because they can't agree on what a "bounce" even means.
Disclosure up front: I run Clickport, one of the tools in this comparison, and its bounce definition is the one I'll argue for. The benchmarks and studies below aren't mine. Judge them on their sources.
- Bounce rate is the percentage of visitors who leave after one page without meaningful engagement. Three tools calculate it three different ways.
- Universal Analytics counted single-page sessions. GA4 inverts engagement rate using a 10-second threshold. Engagement-based tools use scroll depth, time, clicks, and pageviews together.
- Average bounce rates by industry range from 26% (e-commerce) to 65% (blogs and landing pages).
- Google does not use bounce rate as a ranking factor. But the signals behind it (pogo-sticking, dwell time) correlate with rankings.
- The most effective way to reduce bounce rate is matching content to search intent, not adding popups or internal links.
How bounce rate is calculated (three different answers)
There's no single definition of bounce rate. There are at least three. And they hand you very different numbers for the very same website.
Universal Analytics (2005-2023) had the simplest definition. A bounce is a single-page session. Someone lands on your blog post, reads the whole 3,000-word article for 12 minutes, then closes the tab. Bounce. Someone lands on your homepage and hits back in half a second. Also a bounce. Same site, same metric, both counted as the exact same thing.
The formula was: Bounce Rate = Single-page sessions / Total sessions
People called it misleading for years, and they weren't wrong. So Google eventually retired Universal Analytics on July 1, 2023.
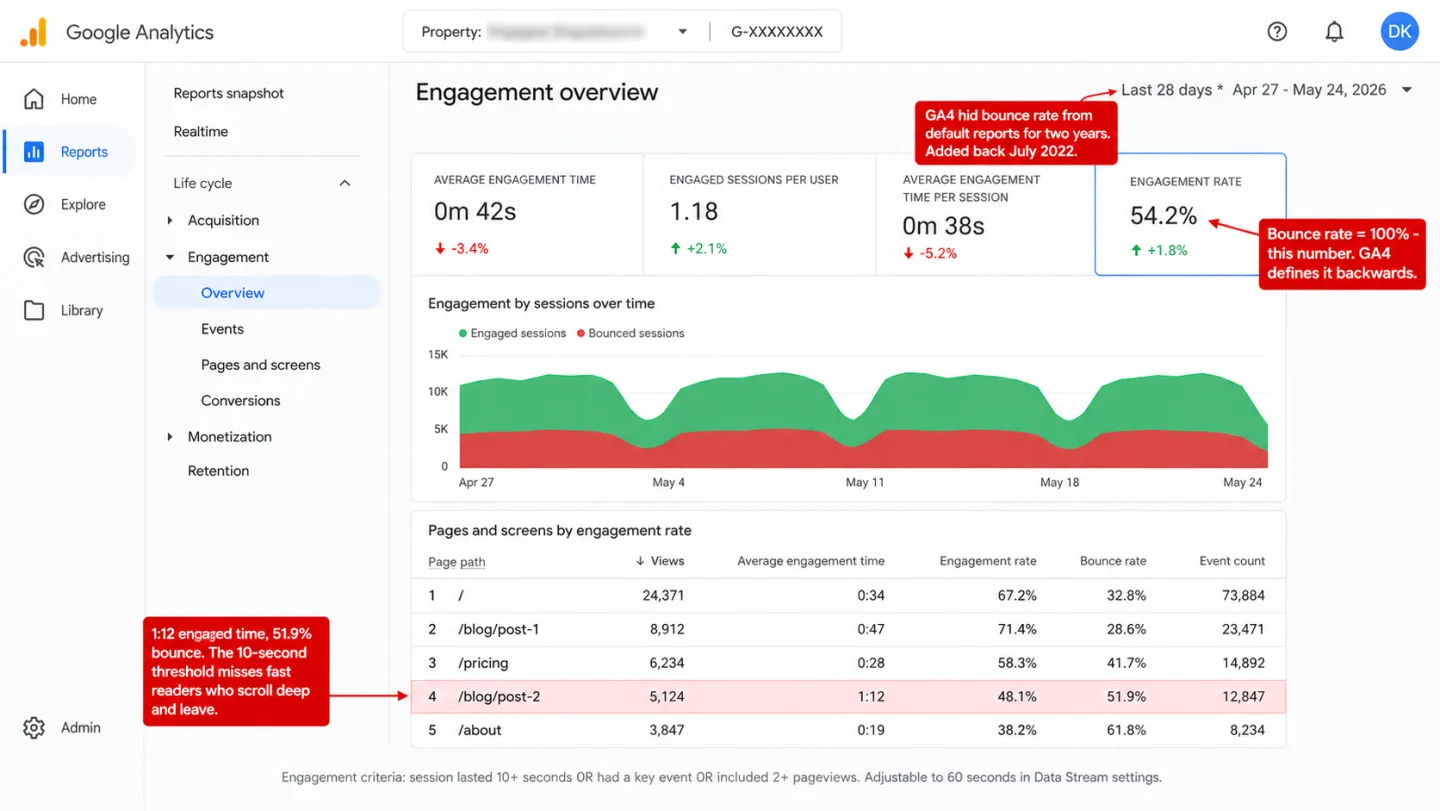
Google Analytics 4 (2020-present) rebuilt the metric from scratch. In GA4, bounce rate is the inverse of engagement rate. A session counts as "engaged" if it does any one of three things: it lasts 10 seconds or longer, it fires a key event (a conversion), or it loads 2 or more pages. Which means everything else is a bounce.
The formula is: Bounce Rate = 100% - Engagement Rate
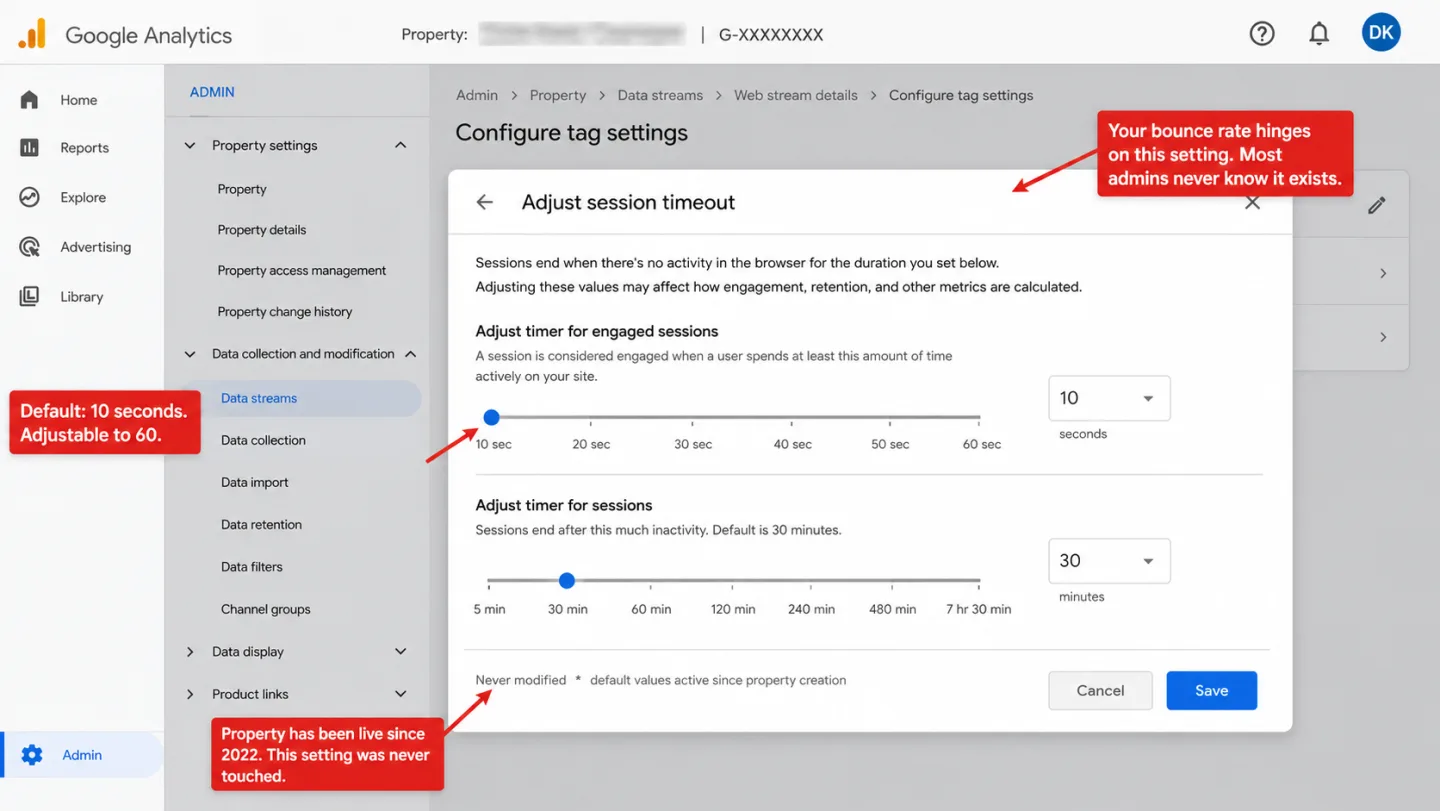
This is a real step up, and I'll give GA4 that. That visitor who read your article for 12 minutes is no longer a bounce in GA4. But 10 seconds is still a number someone picked out of the air. You can adjust it up to 60 seconds in your Data Stream settings. In practice, almost nobody does. The default just sits there, quietly deciding half your traffic.
One detail I see people forget. When GA4 first launched in October 2020, it shipped with no bounce rate at all. Google put engagement rate in its place and expected everyone to move on. The pushback was loud enough that they added bounce rate back in July 2022, this time with the new definition.
Engagement-based tools like Clickport read more than one signal. No single threshold gets to decide on its own. A visitor counts as a bounce only when all four of these are true: single pageview, no outbound clicks, less than 25% scroll depth, and less than 15 seconds on the page. In practice: all four, or it isn't a bounce.
Why does this matter? Picture a fast reader on mobile who scrolls through 60% of your article in 8 seconds. GA4 calls that a bounce, because 8 is under 10. Clickport doesn't, because the scroll depth sails past 25%. Which means same visitor, same behavior, two answers. The definition you pick is the number you see.
What is a good bounce rate?
This is the question I get asked most. Most articles answer it with a single number, and that's the mistake. Bounce rate swings hard by industry, by page type, by traffic source, and by device. One number can't cover all of that.
By industry, Siege Media analyzed 1.3 billion sessions across 42 websites and landed on an average of 50.9%. In practice the spread is enormous. Real estate sites average 40.8%. Travel sites hit 82.6%. Which means a forty-point gap on the same chart. Databox's GA4 benchmarks put the median at 44.8% across all industries.
By page type, the gaps widen again. E-commerce product pages tend to sit at 20-45%, because people browse from one product to the next. Blog posts average 82.4% according to Siege Media's analysis of 84 million blog sessions. Landing pages run 60-90%. In other words: normal is a range, not a number. So "your bounce rate should be under 50%" is advice you can throw away. It depends entirely on the page.
By traffic source, CXL's benchmarks report shows email traffic bouncing at just 35.2%. Of course it does. Those subscribers already know you. Display ads hit 56.5%, because nobody asked to see them and few want to buy. Social traffic sits around 54%, organic search at 43.6%. Translation: the source chooses the bounce rate before your page loads.
By device, mobile bounce rates run 10-12 percentage points higher than desktop in almost every study. In practice, mobile sessions are shorter and come more often. People dip in, get what they want, and dip out.
A 70% bounce rate on a blog is perfectly normal. The exact same 70% on a product page is a problem. The number tells you nothing on its own. The page it sits on tells you everything.
Why high bounce rate is not always bad
This is the point most bounce rate articles skip past, and I think it's the one that matters most. For the same idea applied to landing pages, with a quadrant analysis across 1,007 pages, see how to analyze landing pages: the four signals beyond bounce rate.
A bounce means the visitor left after one page. It doesn't mean the visitor left unhappy. Those are two different things, and the metric can't tell them apart. I'll walk through a few cases.
Someone Googles "how to reset my router." They land on your help article, follow the three steps, and close the tab. That's a bounce. It's also a perfect visit. They came for one thing, got it, and went on with their day.
Someone looks up your restaurant's hours. They find them on your homepage and leave. Bounce. And they're sitting down at your table at 7pm tonight.
Someone reads your whole 2,500-word guide on tax deductions. They spend 9 minutes on the page, scroll to the very bottom, and bookmark it. In Universal Analytics, that was a bounce. In GA4 with the default 10-second threshold, it isn't, because 9 minutes clears 10 seconds with room to spare. In Clickport it isn't either, because the scroll depth alone is past 25%.
So when do I treat a high bounce rate as real? When it lands on a page where you needed the visitor to do something next. A pricing page at 85% says people aren't finding what they expected. A product page at 90% usually means a UX snag or a content mismatch. A checkout page with high bounce almost always means something is broken. Go fix that one.
Spend your time where the bounce rate costs you something. An 80% bounce rate on a blog post that ranks well and feeds your newsletter isn't a problem. It's a post doing its job.
Does bounce rate affect SEO?
Short answer: Google says no. The longer answer is the one I find worth reading.
Google has said this plainly for more than a decade, over and over. John Mueller, Google's Search Advocate, said in 2020: "I think there's a bit of misconception here that we're looking at things like the analytics bounce rate when it comes to ranking websites, and that's definitely not the case." Gary Illyes put it in five words in 2017: "bounce rate is not a good signal." Matt Cutts said the same in 2008, 2010, and 2012. Three Googlers, fourteen years, one answer.
The reason is simple once you see it. Not every site runs Google Analytics. If Google ranked on GA bounce rate, sites with GA would be judged on data sites without GA never produce. That's a measurement bias Google can't build a search engine on.
So that settles it. Except it doesn't.
During the 2023 DOJ antitrust trial, Google's VP of Search Pandu Nayak confirmed under oath that Google runs a system called NavBoost that re-ranks results based on how people click. NavBoost watches "good clicks" (someone clicks a result and stays), "bad clicks" (someone clicks and bounces straight back to the results), and "last longest clicks" (the final result they settle on). It does this over a rolling 13-month window of pooled click data.
This isn't your bounce rate. It's pogo-sticking: how fast people click back to Google. But the two move together. A page that sends people back to the results racks up "bad clicks" in NavBoost. A page that holds them racks up "good clicks."
So both things are true at once. Google doesn't touch your analytics bounce rate. Google does watch its own click data from the results page. And the practical lesson, as I read it, lands in the same place either way. Improve your content and your experience for real, and your NavBoost signals improve with it. Game your bounce rate with auto-redirects and forced second pageviews, and you've moved a number on your screen while Google keeps watching the clicks you can't fake.
Did they stay 10+ seconds? (GA4)
Visible to: you (not Google)
How long did they stay before returning?
Visible to: Google (not you)
What causes high bounce rate
Say you've got a bounce rate that really is a problem, on the wrong page type, for the wrong traffic. Here's what I found behind it. Not theories. Data.
Page speed
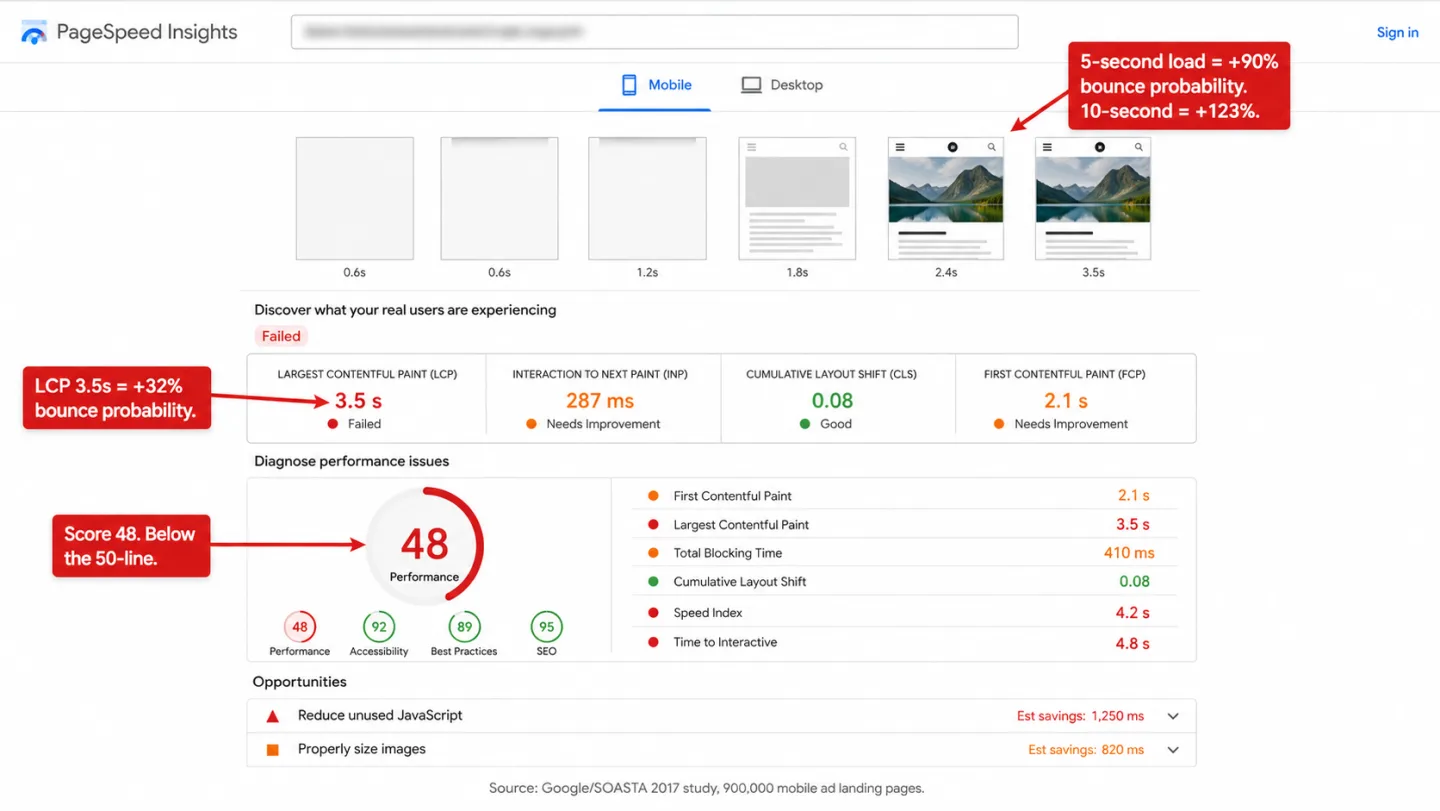
Speed is the biggest cause, and the research isn't close. A 2017 Google/SOASTA study of 900,000 mobile ad landing pages found that as a page goes from loading in 1 second to loading in 3 seconds, the chance of a bounce climbs 32%. At 5 seconds it jumps 90%. At 10 seconds it more than doubles, 123%. In plain English: every second you make people wait, more of them give up.
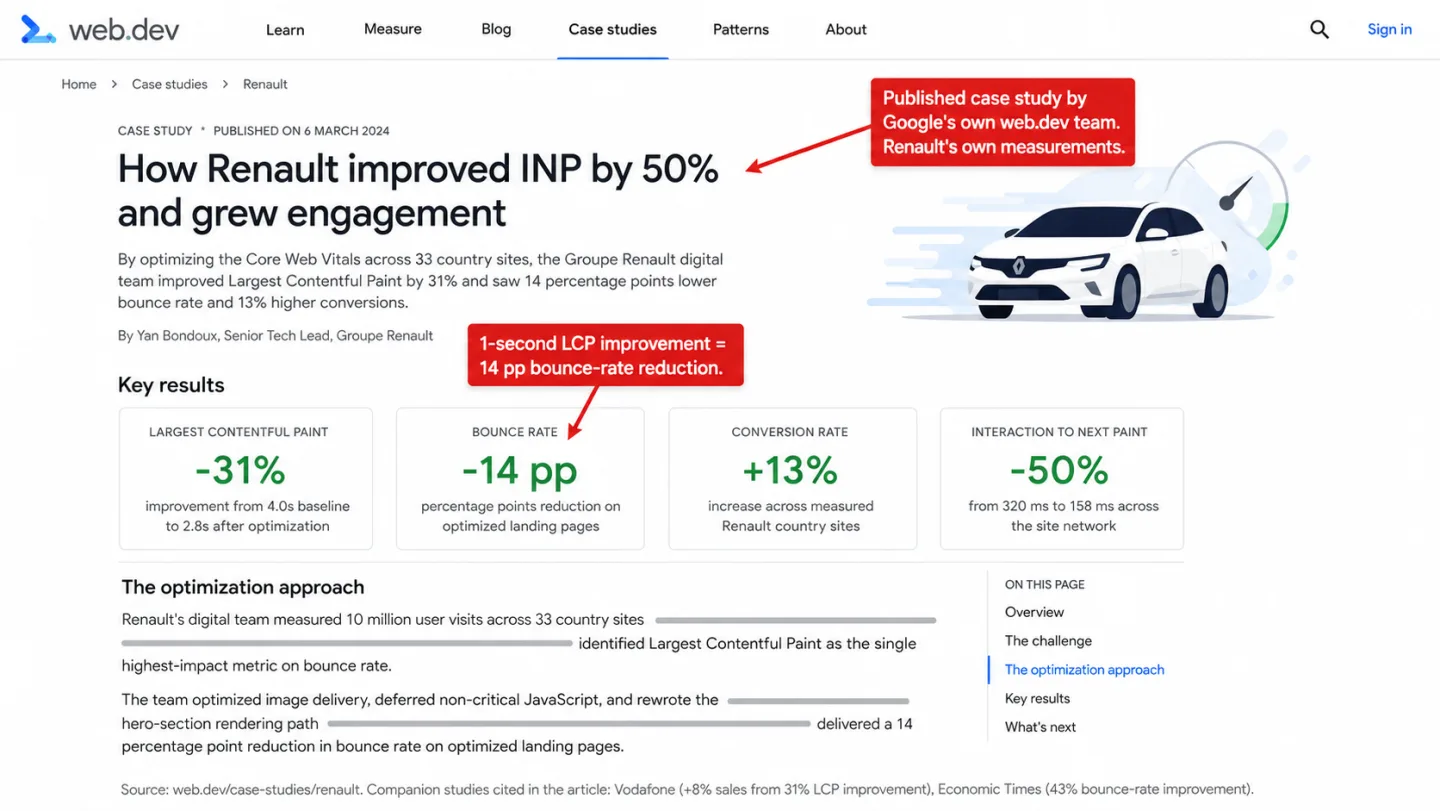
Renault's case study on web.dev measured 10 million visits across 33 countries. Shaving 1 second off Largest Contentful Paint (LCP), the moment the main content finishes loading, lined up with 14 percentage points lower bounce rate and 13% higher conversions. Deloitte's "Milliseconds Make Millions" study ran the numbers on 30 million sessions and found that even a 0.1-second improvement in mobile load time cut bounce rates on lead-gen pages by 8.3%. Put another way: one tenth of one second. That's how thin the patience is.
Content mismatch
When your page doesn't deliver what the search query or the ad promised, people leave. This is the most common cause of a high bounce rate on landing pages. Rank for "free analytics tool" and then shove a paid plan in their face, and they're gone. Open your top landing pages in Google Search Console and read the queries bringing the traffic. Then ask if the page answers them.
Mobile experience
Most of your visitors are holding a phone. 62-64% of global web traffic now comes from mobile, so a bad mobile experience bleeds bounces. The usual suspects: text too small to read without pinching, buttons crammed too close together (Apple says tap targets should be at least 44x44 points, Google says 48x48 dp), forms with too many fields, and popups in the way. 73% of web designers point to layouts that aren't built for mobile as a top reason people leave. Which means nearly three in four. The people who build sites for a living already know where this goes wrong.
Intrusive popups
Full-screen popups on mobile do the most harm. They cover the thing the visitor came for, on the smallest screen there's. Google has penalized intrusive mobile interstitials in search rankings since January 2017, so the popup that scares people off can cost you the ranking too. A smaller banner that sits politely at the edge tends to collect almost as many emails, minus the bounce spike. You give up very little and keep the visitor.
How to reduce bounce rate
Seven moves, every one backed by data I could check, not "best practices" someone made up over lunch.
1. Fix your page speed first
I'd start here, because nothing else moves the number as much. Vodafone improved LCP by 31% and sold 8% more. The Economic Times tuned their Core Web Vitals and cut their bounce rate by 43%. Same lever, two industries, both paid off.
Open PageSpeed Insights and knock out the obvious wins: compress images to WebP, strip out unused JavaScript, put static assets on a CDN, and lazy-load anything below the fold. Aim for LCP under 2.5 seconds. That's the line you're chasing.
2. Match page content to search intent
Pull the real search queries landing on each page, in Google Search Console or in Clickport's Pages panel. Then put yourself in the visitor's chair. If someone typed that exact phrase, does your page hand them what they wanted in the first few seconds, or make them dig? If they have to dig, they leave.
3. Put your value proposition above the fold
Nielsen Norman Group's eye-tracking research found that 57% of viewing time goes to whatever's above the fold. In other words: over half the attention, spent before anyone scrolls. So the first screenful has to tell the visitor they're in the right place. On a product page that means the image, the price, and the "Add to Cart" button all sit there in view, no scrolling required.
4. Use internal links strategically
Not buried in a "Related posts" widget at the bottom, where almost nobody scrolls. Put the links inline, in the text, where they fit the point you're making. Link to the thing that answers the reader's next question. Every good internal link is a door to a second page, and a second page is the opposite of a bounce.
5. Optimize your mobile experience separately
Split your bounce rate by device and look. If mobile sits well above desktop, you've found the problem, and it isn't your content. The fixes are dull and they work: bigger fonts, more space between tap targets, fewer form fields (HubSpot found that switching to mobile-smart forms cut bounce rates by an average of 27%), and a sticky header so navigation is always within thumb's reach.
6. Add video content
Brafton measured a 34% lower bounce rate on pages with an embedded video. That means a third fewer bounces, just by giving people something to watch. Keep it under 2 minutes for general content, because attention falls off a cliff after that. Put it near the top. And lazy-load the embed so the video doesn't drag down your load time and undo strategy number one.
7. Show social proof and reviews on product pages
On e-commerce pages, reviews do real work. PowerReviews found that showing 1 to 100 reviews lifts conversion by 76.7%, and products with 5,000 or more reviews see lifts above 250%. In practice you don't need thousands to start. Going from zero reviews to a handful already moves the needle. Reviews answer the quiet "is this worth it?" that makes people hesitate, and a visitor who stops hesitating stops bouncing.
Bounce rate vs. engagement rate
GA4 put engagement rate front and center and pushed bounce rate to the back, opt-in, not even shown by default in the reports. There's a real idea behind the swap, and I agree with it. Measuring what people do tells you more than measuring what they don't.
The trouble is there are five close cousins here, and I watch people mix them up all the time.
Bounce rate measures single-page sessions with no real engagement. The exact line depends on your tool (see section 1).
Engagement rate is the share of sessions that clear the engagement bar (10+ seconds, 2+ pageviews, or a key event in GA4). It's bounce rate flipped: the two always add to 100%. Cross-industry averages tend to land in the 56-62% range. That means most sites clear the 10-second bar just over half the time.
Exit rate is the share of pageviews on a given page that happened to be the last one in a session. Every session ends somewhere, so every page has an exit rate. If 40% of the pageviews on your blog post are the last thing before the visitor leaves, that's a 40% exit rate. Unlike bounce rate, it counts all sessions, not just the one-page ones.
Dwell time is the gap between clicking a search result and clicking back to the results page. It only exists for search traffic. Google's NavBoost leans on related click signals (good clicks, bad clicks, last longest clicks), but Google has never named "dwell time" as an official metric or a ranking factor. People say it as if Google confirmed it. Google didn't.
Time on page is how long someone spends on one page. Universal Analytics worked it out from the gap between two pageviews, which meant the last page of every session, and every bounced session, logged a flat zero. GA4 and Clickport both use the Page Visibility API to count only the time the tab is in front of you.
Moving from bounce rate to engagement rate was the right call. What people do is something you can act on. What they don't do is a shrug. But engagement rate carries the same flaw bounce rate did. One number can't hold the whole story. That's why scroll depth and active time on page earn their place next to it.
Your bounce rate is probably wrong
If you run cookie-based analytics like Google Analytics, your bounce rate is built on a partial view of who showed up.
In Europe, a big chunk of visitors reject or ignore analytics cookies the moment a compliant consent banner appears. Controlled studies (USENIX/CNIL 2024) measured rejection rates of 34-47% depending on how the banner was built, and real-world CMP data from Advance Metrics and etracker shows only 25-40% of visitors actively click accept. In plain English: the rest still browse your site. They still read your posts. They still buy your products. They just never reach your analytics. On top of that, roughly 30-43% of internet users worldwide run an ad blocker depending on how you count, and in Germany it's 49%, near enough half. Plenty of those block Google Analytics out of the box.
So what does that do to your bounce rate? It tilts the sample. The people who accept cookies and skip ad blockers skew less privacy-minded and less technical, and there's no reason to assume they behave like the people you can't see. Your bounce rate comes from maybe 40-60% of your real traffic. Which means the sample is tilted, not just small.
This isn't a rounding error. When the UK's Information Commissioner's Office, the regulator that enforces privacy law, put a properly compliant consent banner on its own website, its tracked traffic fell by 90.8%. Translation: nine in ten visitors, gone from the data. On the website of the people who write the rules.
GA4's Consent Mode v2 tries to patch the hole by "modeling" the non-consenting visitors with AI. So now you're handed an estimate dressed up as analytics. For a metric as touchy about context as bounce rate, stacking a guess on top of an already lopsided dataset doesn't make the number sturdier. It makes it harder to trust.
This is why privacy-friendly analytics tools that work without cookies, and ask for no consent banner, give you a truer read on your bounce rate. The math isn't smarter. It's just counting the visitors the banner was hiding.
How Clickport measures bounce differently
Most tools treat a bounce as a yes-or-no question. GA4 asks one thing: did the session last 10 seconds? Yes or no, done. I built Clickport to ask more.
Clickport asks four things instead. A session is a bounce only when all of these are true:
- Single pageview. The visitor never moved to another page.
- No outbound clicks. They didn't click any external link.
- Less than 25% scroll depth. They barely looked at the content.
- Less than 15 seconds on page. Active time, measured with the Page Visibility API, so a tab left open in the background doesn't count.
Miss any one of those and it's not a bounce. Read for 8 seconds but scroll to 60%? Not a bounce. Sit on the page for 20 seconds and never scroll? Not a bounce. Click an outbound affiliate link after 5 seconds? Not a bounce. The single visitor GA4 would have written off shows up here as what they were: someone who did something.
That's the whole point. One threshold throws away the cases that don't fit it. The scroll check catches the fast reader. The click check catches the visitor who converted by leaving for an affiliate or referral link. The time check counts real attention, not "a tab was open somewhere."
And because Clickport runs without cookies, there's no consent banner and no tilted sample. Your bounce rate comes from everyone your consent banner used to hide.
Summary
Bounce rate is a useful signal. I just want you to know what it measures and what it leaves out.
The definition matters. Universal Analytics, GA4, and engagement-based tools like Clickport each count a bounce their own way. The same website reads differently in each one. Find out which definition your tool uses before you draw a single conclusion.
Context beats the number. A 75% bounce rate on a blog post is normal. The same 75% on a product page is a problem. Always read it against the right benchmark for your page type, your industry, and your traffic source.
Google doesn't rank on your bounce rate. It ranks on its own click data, NavBoost, from the results page. So improve your content and experience for real. Gaming a number you control does nothing to a number Google controls.
Speed is the biggest lever. If I could make you fix one thing, it'd be your page speed. Every study points the same way, and none of them are subtle about it.
Your data is probably incomplete. On cookie-based analytics you're working from a fraction of your real traffic. It's worth asking whether a privacy-friendly analytics tool that counts the visitors your banner hides would give you a number you can trust.
Bounce rate is a starting point, not a finish line. The real question was never "what's my bounce rate?" It's "are my visitors finding what they came for?" Metrics like scroll depth, active time on page, and click tracking get you far closer to that answer than one percentage ever could.
If you'd like to see your bounce rate built from all of your traffic with engagement-based criteria, try Clickport free for 30 days. And if your bounce rate still confuses you after all this, email me a screenshot. I answer every email.

Comments
Loading comments...
Leave a comment