Everything Wrong with GA4's Engagement Overview (With Data)
Show article contentsHide article contents
- What GA4's engagement overview actually shows you
- The 10-second threshold that breaks everything
- Bounce rate is not bounce rate anymore
- Average engagement time underreports by up to 80%
- Scroll tracking that tells you nothing
- What engagement data should actually look like
- The hidden problem: bots inflate your engagement metrics
- What to measure instead of GA4's engagement rate
- FAQ
Ten seconds. That is all it takes for GA4 to call a visitor engaged. The number is a binary threshold, inverted and dressed up as a rate. A visitor who stares at your loading spinner for 11 seconds and leaves counts as "engaged." A visitor who reads your entire article in 8 seconds flat does not. GA4's engagement rate measures clock time, not reading. It is the most misleading metric in modern analytics.
I spent weeks digging into how GA4's engagement metrics work: what they measure, what they miss, and what the data says about their accuracy. The findings are worse than I expected.
For the same metric applied specifically to landing pages, including the four-signal framework that replaces it, see how to analyze landing pages.
- GA4 classifies a session as 'engaged' if it lasts 10 seconds, has 2+ pageviews, or triggers a conversion. A visitor who stares at a loading screen for 11 seconds counts as engaged.
- A 28-day comparison study found GA4 underreports average engagement time by 54.7% on average, with some pages off by 80.2%. The cause: non-engaged sessions contribute zero time but inflate the denominator.
- One site showed 86% bounce rate in Universal Analytics and 24% in GA4 for the same traffic in the same period. Google redefined the formula, not the name.
- GA4's built-in scroll tracking fires a single event at 90% depth. No 25%, 50%, or 75% data. Fixing it requires Google Tag Manager, a multi-tool setup most site owners never complete.
- Engagement rate is calculated from a mix of human and bot traffic. With 51% of web traffic automated, GA4 users without bot filtering are measuring engagement across sessions that never had a human behind them.
What GA4's engagement overview actually shows you
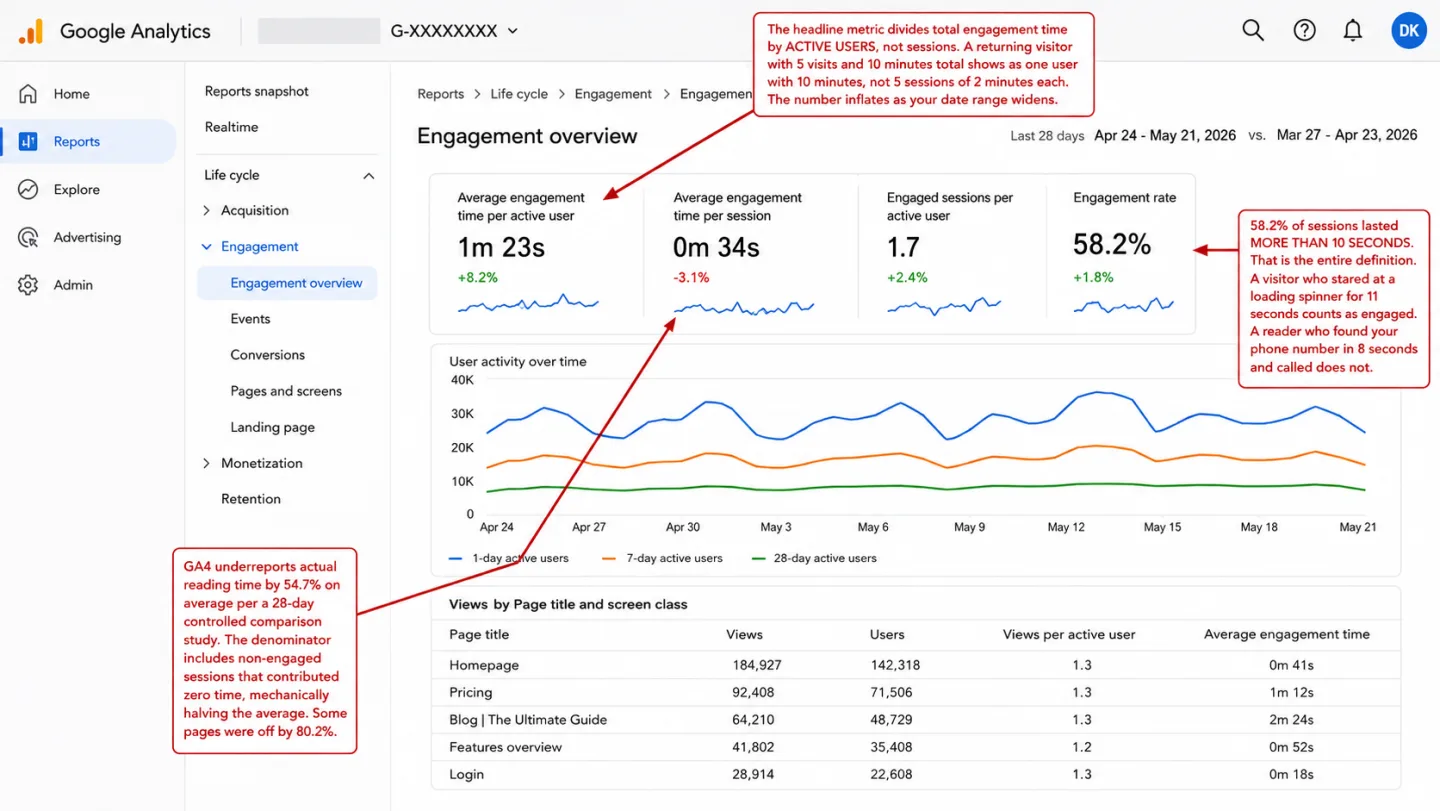
The Engagement overview is the first report most people open when they want to know if their content is working. It shows four summary cards: average engagement time, views, event count, and user activity over time.
The trouble starts at the top. "Average engagement time" sounds like it answers one simple question. How long do visitors spend on my site? It does not. GA4 divides total engagement time by active users, not sessions. So a person who visits 5 times in a week, 2 minutes each time, shows up as 10 minutes of average engagement time. Not 2 minutes. The per-session number does exist. It is called "average engagement time per session," and it is buried in Explorations, far from the default report.
÷ Total sessions
= Time per visit
÷ Active users
= Time per person (all visits combined)
Anyone coming from Universal Analytics expects a per-session number. UA's "Avg. Session Duration" was total duration divided by sessions. GA4 leads with the per-user version instead. The swap catches most people off guard.
The rest of the overview is no better. "Views" counts repeat views of the same page on their own, so one person refreshing a tab inflates the number. "Event count" piles auto-collected events like page_view, session_start and user_engagement in with real interactions, so the total means nothing until you filter it. "User activity over time" is a line chart of active users and nothing more. None of it tells you whether anyone read a word.
The 10-second threshold that breaks everything
GA4 calls a session "engaged" if it meets any one of three things: it lasted longer than 10 seconds, it had 2 or more pageviews, or it triggered a key event (a conversion). That is the whole bar.
Picture what that looks like in real life. A visitor lands on your page. Your site takes 6 seconds to render because the JavaScript is heavy. They glance at it for 5 seconds, decide it is not what they wanted, and leave. Total time on the page: 11 seconds. GA4 verdict: engaged.
Now flip it. Someone searches for your phone number, finds it in 8 seconds, calls you, and becomes a customer. GA4 verdict: not engaged. One pageview, under 10 seconds, no conversion event tracked. The customer counts as not engaged. The person who bounced counts as a win.
Page took 6s to load
Looked around for 5s
Left disappointed
Total: 11 seconds ✓
Found phone number
Called and became a customer
Left satisfied
Total: 8 seconds ✗
Julius Fedorovicius, founder of Analytics Mania, put it plainly: "What if I land on your website, stay for 11 seconds on a page doing nothing, and then leave? Would you consider me an engaged visitor?" He suggests pushing the threshold to at least 30 seconds, because "staying 10 seconds on a page is not enough to consider this as an engagement."
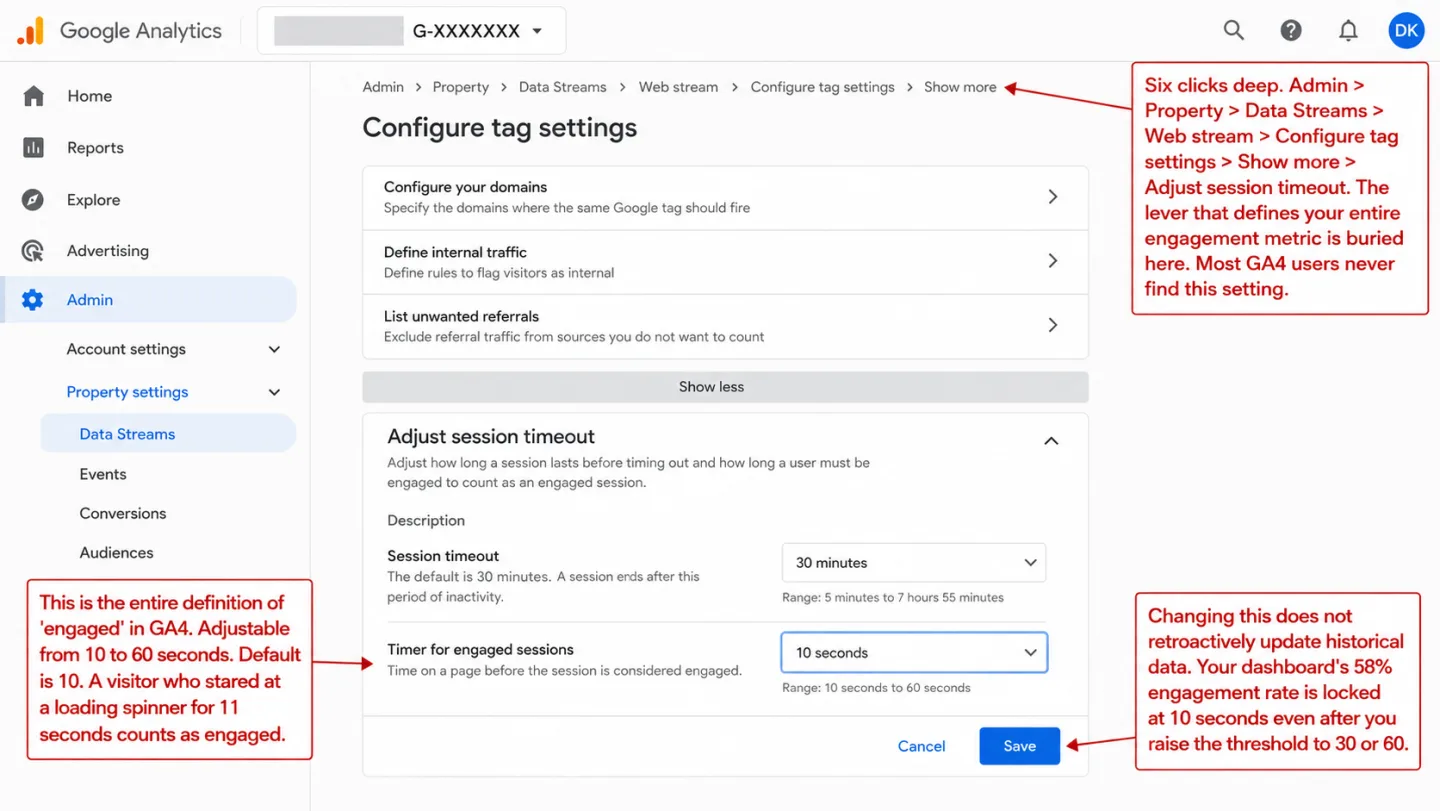
You can move the threshold. GA4 lets you raise it from 10 to 60 seconds in the tag settings. Most people never do, because most people do not know it is there. And even at 60 seconds you are still counting clock time, not engagement.
The deeper trouble is that 10 seconds means a different thing on every page. A 10-second visit to a recipe page, where someone snaps a photo of the ingredients and goes shopping, is a win. A 10-second visit to a pricing page is a loss. GA4 scores them both the same.
Why 10 seconds? Nobody knows. There is no published research behind the number. It appears nowhere in the documentation. Google simply declared it, and the whole metric chain stacks on top: engagement rate, bounce rate, average engagement time. Every one of them inherits the same guess.
Bounce rate is not bounce rate anymore
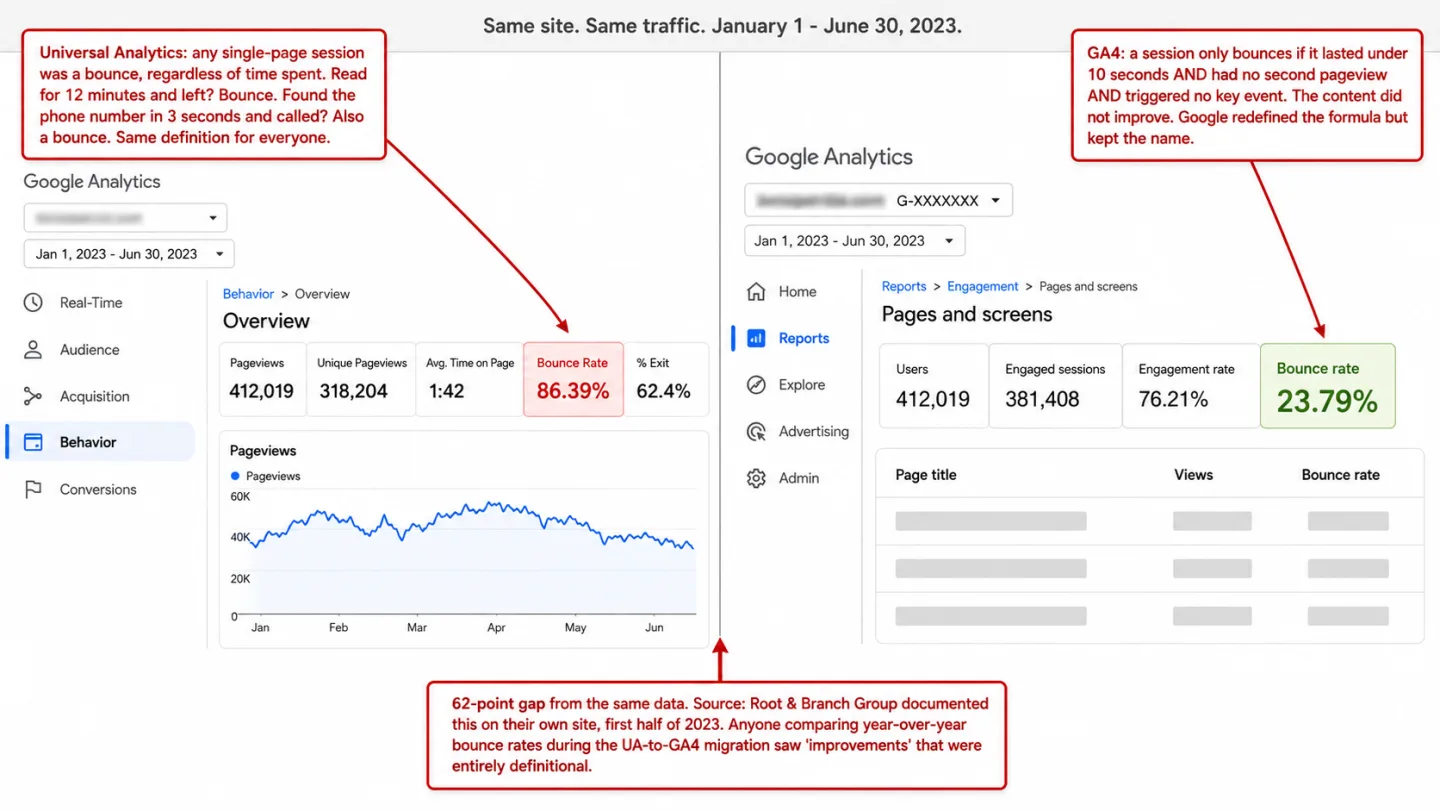
In Universal Analytics, bounce rate was simple. It was the share of sessions where someone viewed one page and triggered no interaction events. Read an article for 12 minutes and left? Bounce. Found the phone number in 3 seconds and called? Also a bounce. It was a blunt tool, but everyone agreed on what it meant.
In GA4, bounce rate is the exact inverse of engagement rate. Bounce rate = 100% - Engagement rate. A session is a "bounce" only when it lasted under 10 seconds AND had fewer than 2 pageviews AND triggered no key event. Same word. A completely different formula underneath.
Google pulled bounce rate out of GA4 altogether when it launched in October 2020. After years of backlash, they put it back in July 2022, this time with the new meaning. By the time Universal Analytics was switched off in July 2023, the old bounce rate was gone for good.
What you get instead is noise. Root & Branch Group documented a direct comparison on their own site for the first half of 2023. Universal Analytics reported an 86.39% bounce rate. GA4 reported 23.79% for the same traffic in the same period. That is not a rounding error. It is a 62-point gap, and the only thing that changed was the formula behind the word.
Even the UK government noticed. GOV.UK's data documentation says it flat out: "Neither UA nor GA4 data is 'correct'. The two datasets are simply very different."
The damage from this is real. Agencies that compared year-over-year bounce rates through the UA-to-GA4 migration watched clients cheer "improvements" that were nothing but a change of definition. Marketing teams shifted strategy on the back of numbers with no grounding in the real world. And anyone lining up an old report next to a new one is comparing two different metrics wearing the same label.
Average engagement time underreports by up to 80%
Plausible Analytics ran a 28-day controlled comparison in March-April 2025. Same traffic, same site, measured with both GA4 and their own time-on-page tracking side by side. The gap was hard to miss. (Plausible is one of several tools we cover in our GA alternatives comparison.)
GA4 underreported average engagement time by 54.7% on average. So on a typical page, GA4 showed roughly half the time people really spent. On individual pages it got worse, with the gap reaching 80.2%. One page read 16 seconds in GA4 against 1 minute 21 seconds in Plausible's measurement. Another read 34 seconds against 2 minutes 33 seconds.
The root cause is the denominator problem again. GA4 works out average engagement time per session by dividing total engagement time by all sessions, the non-engaged ones included, even though those contributed zero time. In the Plausible study, around 50% of all sessions were tagged non-engaged. They added nothing to the top of the fraction but stayed in the bottom of it. That alone cuts the average roughly in half.
The data pipeline makes it worse. GA4 builds up engagement time in the browser and ships it as engagement_time_msec attached to the next event that fires. If no next event fires, say a single-page visit where the person just closes the tab, that time can vanish. GA4 leans on navigator.sendBeacon() during page unload to grab the final slice. As David Vallejo documented, researchers have measured roughly 40% of data going missing when sendBeacon is paired with unload events. So on Mobile Safari, where iOS can kill a page without firing any unload event at all, the loss is even higher.
The Google Analytics Community forums are full of people reporting engagement time stuck at 0 seconds while their users are plainly clicking through several pages. One thread sums it up: "engagement time shows 0s since converted to GA4 but it shows users go to various website pages."
If your content plan depends on knowing how long people really spend reading your pages, GA4's default metrics are not the place to look.
Scroll tracking that tells you nothing
GA4's built-in scroll tracking fires one event when a visitor reaches 90% of the page. One event. One threshold. One time per page. That is the whole feature.
It is a yes or no. Either they reached 90% or they did not. You cannot tell a reader who got 85% of the way down your article apart from one who left after the headline. Both leave the same trace, which is no scroll event at all.
On a 300-word landing page, 90% barely means anything. Almost everyone reaches the bottom of a short page. On a 5,000-word guide, getting to 90% is real, deep reading. GA4 treats the two the same, because the 90% threshold never adjusts for how long the page is.
The real insight lives in the drop-off between thresholds. If 84% of visitors reach 25% but only 52% reach 75%, you know readers are giving up in the middle of the piece. That you can act on. GA4's yes or no at 90% never tells you where the bleeding starts.
You can build granular scroll tracking in GA4, but only through Google Tag Manager. You create a scroll depth trigger, build a GA4 event tag, register a custom dimension in the admin, then wait 24 to 48 hours for the data to show. That is a second tool and a string of steps most site owners never finish. Without GTM in your hands, the single 90% event is all you get.
Chartbeat's research across 2 billion page visits found scroll behavior swings hard by content type. Blog posts average 40-60% completion at the 75% mark, while landing pages see 60-70% reaching the bottom simply because they are short. Bolt one fixed 90% threshold onto every page type and you do not have scroll tracking. You have a checkbox.
What engagement data should actually look like
The flaw in GA4's engagement metrics is built into the design. They sort sessions into two bins, engaged or not, instead of measuring anything. A good engagement metric tells you how engaged someone was, not just whether they cleared a bar.
Here is what matters if you want to understand how your content performs:
A score, not a flag. Engagement is not a yes or no. It is a spectrum. Fold scroll depth and time on page into one 0-100 score and you get a number you can sort by, compare across sources, and watch over time. "72% engagement" tells you far more than "engaged: true."
Per-source engagement, on screen by default. The question worth asking is not "what is my overall engagement rate?" It is "which sources bring me readers, and which bring me clickers?" The moment you see newsletter subscribers engaging at 87% while social traffic sits at 32%, your distribution plan changes. That split should sit in your sources panel at a glance, not hide in Explorations.
Real reading time that stops when the tab is hidden. GA4 says it does this. In practice it leaks time on a second monitor, where the page stays "visible" while the person works elsewhere, and it loses time to sendBeacon failures on the way out. A clean version listens to both visibilitychange and blur/focus, counts time only when the tab is visible and focused, and caps the average at 30 minutes so a forgotten tab cannot warp the data.
A bounce rate that can tell reading apart from bouncing. GA4's bounce rate is the flip side of engagement rate, so it carries the same 10-second flaw. A better version takes several signals at once. A visit is a bounce only when it has one pageview AND no clicks AND less than 25% scroll AND under 15 seconds on the page. Read the whole article in one sitting? Not a bounce. Scroll halfway and leave? Not a bounce. Land and walk straight back out? Bounce. That is what the word was always supposed to mean.
Copy detection. When someone selects and copies text off your page, that is the clearest sign they found something worth keeping. No click, no scroll threshold, no timer. They picked your words out by hand because they wanted them. Clickport tracks this automatically. No other analytics tool does.
The hidden problem: bots inflate your engagement metrics
There is one more flaw under all the others, and it rarely gets named. Your engagement rate is worked out from a blend of human sessions and bot sessions. With no bot filtering in place, the denominator is dirty.
The Imperva 2025 Bad Bot Report found 51% of all web traffic in 2024 was automated. More than half of it was not a person. Bad bots alone made up 37%, up from 32% the year before, the sixth year of growth in a row, as AI keeps lowering the bar to build a scraper.
GA4 has one line of defence against bots: the IAB/ABC International Spiders and Bots List. If a bot announces itself, GA4 drops it. If it wears a normal browser user-agent, which most modern bots do, GA4 logs it as a real visitor.
Here is what that does to your engagement numbers:
200 bot sessions at 0% engagement
diluting the average
Bot sessions removed before calculation
real engagement visible
Bot sessions are the worst thing you can feed an engagement calculation. They last 0-1 seconds. They scroll 0%. They click nothing. By any definition, they are never engaged. Every bot session in your data pulls your engagement rate down and pushes your bounce rate up, so your content looks worse than it really is.
The KISSmetrics 2024 analysis found most GA4 setups are missing 10-30% of their data to ad blockers, consent mode, and configuration mistakes. Stack bot contamination on top, and the engagement figure GA4 hands you is a guess built on a guess.
A real engagement system filters bots before it does the math, not after. Strip the bot sessions at ingestion and your engagement rate reflects humans only. The shift is usually 10-20 percentage points. That is wide enough to change which content and which channels you decide are working.
What to measure instead of GA4's engagement rate
If GA4's engagement metrics cannot be trusted, what should you track instead? The answer is not "a better engagement rate." It is a different way of looking at the whole thing.
Scroll depth distribution, not one threshold. Track the share of visitors who reach 25%, 50%, 75%, and 100% of each page. The shape of that curve shows you where your content loses people. A steep drop between 25% and 50% means your intro promised something the body never delivered. A gentle slide to 60-70% means the piece works but could be tighter. Pages where readers get past 50% convert at roughly twice the rate of pages where they do not, but only when you pair that with real engagement signals like clicks and interactions.
Real time on page, per source. Not "average engagement time per active user." Not "average engagement time per session watered down by zero-time non-engaged sessions." The real time the tab was visible and focused, per page, split by where the traffic came from. The day you see organic search visitors spending 3:42 on your guide while social visitors spend 0:48, you know where to put your effort.
Interaction signals beyond the clock. Clicks, form submissions, copy events, outbound link clicks. These are things people do, and doing something signals value. A visitor who copies your recipe ingredients is more engaged than one who blew past 90% at full speed. A visitor who clicked your CTA is more engaged than one who parked on the page for 2 minutes. Time and scroll are inputs. Actions are outcomes.
When high engagement is a bad sign. High engagement on a 404 page means your error page is confusing. High engagement on a checkout page means the process is a maze. High time on an FAQ page means people cannot find what they came for. The context matters more than the number. Any engagement metric that will not let you filter by page type is selling you a false sense of how things are going.
GA4's engagement rate is a binary threshold dressed up as a percentage.
The gap between "62% engagement rate" and "engagement score: 72 from organic, 34 from social, 87 from email" is the gap between a vanity number and a number you can decide on. The first tells you almost nothing. The second tells you exactly where to point your next move.
If you want to see your real engagement, stripped of bot traffic, measured the whole time a visitor is reading instead of at one threshold, and split by every source and page, start a free trial. Two minutes to set up. No credit card. No Tag Manager. No waiting 48 hours for the data to show.
FAQ
What is a good engagement rate in GA4?
Databox benchmarks put the median GA4 engagement rate at 56% across industries, from 52% for SaaS and consulting up to 64% for e-commerce. The low 10-second threshold pads all of those. A 56% engagement rate means 56% of sessions lasted longer than 10 seconds, which says almost nothing about whether anyone engaged with your content.
What is the difference between engagement rate and bounce rate in GA4?
They are the same metric, flipped. Bounce rate = 100% minus engagement rate. A 60% engagement rate is a 40% bounce rate. Both come from the same 10-second threshold, so the second one adds nothing the first did not already say. In Universal Analytics, bounce rate counted single-page sessions no matter how long they lasted. In GA4, it counts sessions under 10 seconds with no second pageview and no conversion.
Why is my GA4 average engagement time 0?
GA4 reports zero engagement time whenever a session is tagged "not engaged," meaning under 10 seconds, one pageview, no conversion. Those sessions get logged at zero even if the visitor really did spend 7-8 seconds on the page. The usual culprits are misconfigured tracking, consent platforms splitting sessions apart, Cloudflare Zaraz integration bugs, or simply a lot of short but real visits.
Can I change the 10-second threshold in GA4?
Yes. Go to Admin, then Data Streams, pick your web stream, click Configure Tag Settings, then Show More, and find "Adjust session timeout." You can move the engaged session timer from 10 to 60 seconds. Two things to know. Most people never find this setting, and changing it does not rewrite your old data.
Does GA4 track scroll depth?
Only at one threshold. GA4's Enhanced Measurement fires a single scroll event when a visitor reaches 90% of the page. Nothing at 25%, 50%, or 75%. No average scroll depth. For granular scroll tracking you need Google Tag Manager, a separate product with its own setup, triggers, tags, and custom dimension registration. Most GA4 users never get that far.
Why is my GA4 bounce rate so much lower than Universal Analytics?
Because the definition changed. UA counted any single-page session as a bounce, no matter how long it lasted. GA4 only counts a bounce when the session ran under 10 seconds with no second pageview and no conversion. On content-heavy sites like blogs, that can drop the reported bounce rate by 40-60 percentage points or more. The content did not get better. The formula did.
What does "engaged session" mean in GA4?
An engaged session is one that meets any one of three things: it lasted longer than 10 seconds, it included 2 or more pageviews, or it triggered at least one key event (a conversion). The events first_visit, first_open, and session_start do not count even if you mark them as key events. One of the three is enough for GA4 to call the session engaged.

Comments
Loading comments...
Leave a comment