Beyond Pageviews: The Engagement Metrics That Actually Matter
The average person spends 28 seconds engaged with a web page. More than half never get past the first screen. Your traffic is up, your pageview counter is climbing, and nobody is reading. That gap, the one between someone arriving and someone caring, is the most expensive problem in web analytics.
One disclosure before we start. I build Clickport, an analytics tool that leans hard on engagement metrics, so I'm selling the medicine I'm about to prescribe. Every claim below has a source, so you can check me rather than trust me.
- 53% of visitors encountering slow-loading pages bounce after a single view, and average engaged time is just 28 seconds. Pageviews tell you someone arrived, not whether your content worked.
- Google confirmed under oath it uses click satisfaction signals (NavBoost) to rank pages, despite publicly denying it for years.
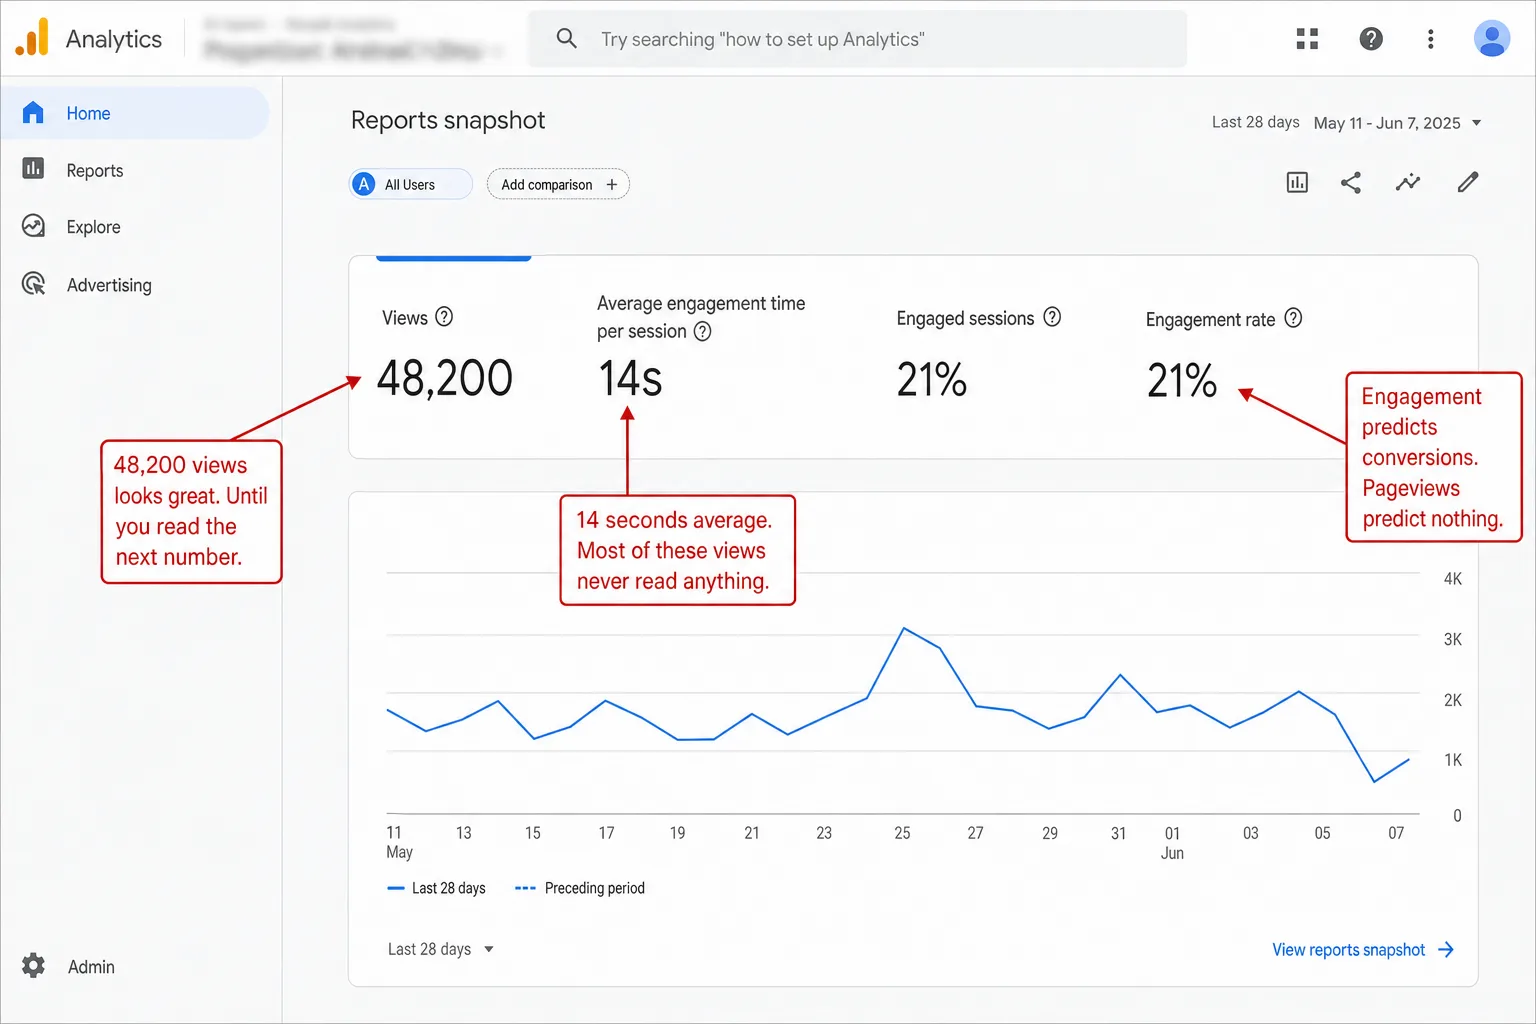
- GA4 underreports engagement time by 55% on average, and cookie consent causes 30-60% data loss on EU sites.
- AI search engines cite content based on depth, entity density, and factual completeness, not traffic volume or backlinks.
- The fix: measure scroll depth, engaged time, return visits, and content-to-conversion paths instead of raw traffic.
The post-click blind spot
I'll start with the number that should worry you: 53% of visitors encountering slow-loading content bounce after viewing a single page. Contentsquare analyzed 90 billion sessions across 6,000 websites and found that page speed is the dominant driver of single-page exits. Across their publisher network in Q1 2025, average engaged time was just 28 seconds. In plain English: half a glance, then gone.
It's getting worse, not better. Contentsquare's 2026 benchmark shows overall engagement fell 10% year-over-year, with fewer pages per session and less scroll. And 40% of all online visits are plagued by user frustration that ends the session early. That means two of every five visits end in frustration.
So your pageview counter is hiding two things from you:
- Most of your "traffic" never engages with your content
- The problem is accelerating as attention fragments across more channels and AI answers
And companies are paying more than ever to buy traffic that converts less. Contentsquare's 2025 benchmark report (90 billion sessions across 6,000 websites) found that brands increased digital ad spend by 13.2% while conversion rates dropped 6.1%. Cost per visit surged 9% in a single year. The brands that leaned harder on paid social saw 9.2% higher bounce rates and 10.6% lower conversions. In other words, they paid more to be ignored.
The traffic number went up. The business results went down. And most dashboards I see only show the first half of that story.
Avinash Kaushik, Google's former analytics evangelist, said it better than I can: web analytics tools "incentivize one-night stands rather than engagements matching customer intent," leading site owners to "insanely expect all visitors to convert right away."
The fix isn't more traffic. It's knowing what your traffic does once it lands. (If you want the full breakdown on how different tools define bounce rate, I wrote a deep dive on bounce rate measurement that covers the three different calculation methods.)
Google is grading you on a test you can't see
Google measures how satisfied people are with your page, and it uses that to rank you. It has done this since 2005. And for years it told everyone it didn't.
The system is called NavBoost. It only came to light in the U.S. Department of Justice antitrust trial in October 2023, where Google VP of Search Pandu Nayak said under oath that "NavBoost is one of the important signals that we have."
NavBoost reads three kinds of clicks from Chrome browser data:
- goodClicks: someone clicked your result and stayed. A good sign.
- badClicks: someone clicked and bounced straight back to the results (pogo-sticking). A bad sign.
- lastLongestClicks: the result where someone spent the most time before they stopped searching. The strongest good sign of all.
Google keeps 13 months of this click data and pours it straight into ranking. That means your visitors are voting on you, whether you're watching or not.
Now I'll line up what Google said in public against what came out in court. Gary Illyes, a Google Search Relations lead, called dwell time and CTR "generally made up crap." John Mueller said pogo-sticking isn't a ranking signal. That was the official line for years.
Then people had to answer questions under oath. Former Google software engineer Eric Lehman testified: "Pretty much everyone knows we're using clicks in rankings." He went further: "We try to avoid confirming that we use user data in the ranking of search results." So the denials weren't a mistake. They were the plan.
Then in May 2024, a big leak of Google's internal API documentation named the parts: NavBoost fields like goodClicks, badClicks, lastLongestClicks, Chrome traffic data (chromeInTotal), and a siteAuthority score.
The trial also surfaced Google's main quality metric: the Information Satisfaction (IS) score. Human raters judge whether a result answers what the searcher wanted, and that judgment trains machine learning systems like RankBrain and BERT.
So here's where I think you stand. Google ranks you on whether people are happy with your page. It sees that through Chrome data and search behavior. You see none of it in your own analytics, unless you track engagement yourself.
You're being graded on satisfaction. Most dashboards only show you who turned up.
Your content ranks but doesn't work
Here's a number that changed how I think about content: 96.55% of all pages Google has indexed get zero organic traffic. Ahrefs looked at nearly 14 billion web pages to find that. Only 3.45% of published content gets any search traffic at all. In other words, the rest is talking to nobody.
The opposite problem is just as common, and harder to see: content that ranks fine and still does nothing for the business. Traffic is up. Rankings hold. Conversions sit flat.
The SEO world has a name for this now: content-market fit. It borrows from the startup idea of product-market fit, and it asks one plain question. Does your content match what the searcher needs? Not what they typed. What they need.
A page can rank for a keyword and still miss the point of the search. KP Playbook wrote up a case where a client's blog post pulled huge organic traffic and held a 27% engagement rate. It ranked for a competitor's pricing keywords. People came looking for the competitor's prices and left at once. The traffic chart looked wonderful. The page was useless.
Google's March 2024 core update went after this directly, pulling the Helpful Content System into core ranking. The goal Google stated: cut "low-quality, unoriginal content" by 40%. On the ground, 837 sites were wiped out of the index, which erased 20 million monthly organic visits.
The pattern is hard to miss, and you've probably lived it. Sites that pruned thin pages and went deeper survived. Sites running on sheer volume didn't.
Backlinko wrote up a case where two articles fighting over the same keyword were merged with a 301 redirect, and clicks rose 466%. A vehicle valuation platform deleted 4.86 million pages, down to 1,500, and organic visits went up 160% while conversions went up 105%. They threw away most of their site and grew.
Less content, matched to what people want, judged by engagement. That's the thing I keep seeing work.
Grow and Convert's "Pain Point SEO" approach puts hard numbers on this. They chase bottom-of-funnel, high-intent keywords instead of high-volume informational ones, and they measured a 4.78% conversion rate against 0.19% for top-of-funnel content. That means a 2,400% difference: the high-intent page converts about 25 times harder than the popular one. Their clients see 150+ demo requests a month this way, with 80% of pages ranking on page one.
The lesson I take from all of this is simple. A page with 1,800 visitors that converts 47 of them beats a page with 12,000 visitors that converts 3. You only get to see that if you measure engagement.
The AI shift: depth over links
Everything so far was about Google. Now there's a second search engine to deal with, and it's AI.
ChatGPT, Perplexity, Google's AI Overviews, and Claude all answer questions that used to send a click to your site. And they pick their sources in a different way from old-fashioned search.
SE Ranking's study of 129,000 domains found that referring domains were the strongest sign of a ChatGPT citation. Sites with 32,000+ referring domains get cited 3.5 times as often as sites under 200. But here's the catch: 85% of the times a brand gets mentioned in an LLM, it comes from a third-party page, not your own site. In other words, what other people say about you counts for more than what you say about yourself.
How you build the page matters just as much. Surfer SEO's study of 57,253 URLs found that AI-cited articles pack in 62% more facts than the ones that go uncited. In practice, more named entities and a clean heading order go hand in hand with more citations.
And there's a sharp finding about where in the page the citation comes from: 44.2% of LLM citations pull from the first 30% of the article. 31.1% come from the middle. 24.7% from the end. Which means nearly half the citations come from the opening. Bury your best answer at the bottom and AI will never reach it.
The gap between old rankings and AI citations is also growing. In July 2025, 76% of AI Overview citations came from the top-10 organic results. By February 2026, that overlap had fallen to roughly 17-38%. That means close to half of what AI Overviews quote now comes from pages ranking below position 5. Being number one is no longer the ticket it was.
This changes how I think about content, and probably how you should too. Old SEO rewarded a page for ranking on a keyword, deep or shallow. AI search rewards the page that truly answers the question. If real people don't stay and read your content, AI won't quote it either. The two run together.
The zero-click problem is speeding up at the same time. 60% of Google searches now end with no click to any website. On mobile it's 77%. When an AI Overview shows up, the zero-click rate jumps to 83%. In practice, organic click-through rates in the US fell to 40.3% between March 2024 and March 2025. Fewer of your rankings turn into visits every year.
Rand Fishkin put it plainly: "In a zero-click world, traffic is a terrible goal." The question is no longer how many people you can drag to the site. It's whether, once someone does land, you answered them so well that both they and the AI remember you.
The metrics that actually matter
If pageviews and sessions aren't enough, what should you watch instead? Here are the engagement signals I'd watch first, the ones that tell you whether your content is hitting the mark.
Scroll depth tells you whether people see your content at all. Nielsen Norman Group's eyetracking research found that 57% of viewing time happens above the fold, and 74% within the first two screens. In one usability test, 6 of 8 people never scrolled past a hero section that looked like the end of the page. In plain English: if it looks finished, they stop. For long-form pieces over 2,000 words, an average scroll depth of 60-80% is strong. Under 25% means most readers see a fraction of what you wrote.
Engaged time tells you whether people read or just glanced and left. The cross-industry average is 54 seconds per pageview, though it swings hard by content type. A blog post that holds readers for 3-5 minutes is doing its job. For top-10 Google results, average dwell time is 3 minutes 10 seconds. And Chartbeat found the payoff: hold someone for 3 minutes and they're twice as likely to come back as someone you held for 1. In plain English: minutes build the habit, visits don't.
Return visit rate is the clearest sign of content-market fit. Chartbeat found that people who read 2 pages are 2.75 times more likely to return than people who read 1. The return rate climbs from 8% at one page to 22% at two pages. By 11 pages or more it reaches 74%. That means the second pageview is the hinge. In e-commerce, returning visitors convert about twice as well as new ones and spend around 16% more per order. The people who come back are the people worth having.
Session depth, or pages per session, tells you whether people are exploring or leaving. More pages per session tracks closely with longer sessions. Organic search drives the deepest visits. Paid social drives the shallowest, with 8.7% fewer pageviews per session. In other words, the traffic you pay for explores the least.
Form and click interactions catch the small wins that raw traffic ignores. 67% of people abandon a form the moment it gets fiddly. Trim the fields down to 3 and conversions can rise by about half, per HubSpot's look at 40,000 landing pages. That means the shortest form usually wins. Tracking outbound link clicks, copied text, and downloads paints a far fuller picture of what people want than pageviews ever could.
Here's what that looks like in the product I built. This is a Clickport dashboard showing all six of those numbers at a glance for a real site. No setup, no custom events, no Tag Manager. Every metric is tracked from the first pageview on.
One warning before you go chasing these. Avinash Kaushik made the sharpest case against engagement metrics years ago: "Engagement is not a metric, it's an excuse." His point was that "engagement" used as a vague catch-all lets teams dodge the hard part, which is tying any of it to the business.
He's right, and I say that as someone selling engagement metrics. Scroll depth on its own means nothing. Scroll depth set against conversion rate by content type tells you which articles earn their keep. The metrics above only work when you combine them and join them to outcomes. A dashboard full of green engagement numbers that never turns into revenue is just a vanity metric in a different colour. Don't build that dashboard.
Your analytics are lying to you
Say you're tracking all the right metrics. I have more bad news: there's still a good chance the numbers themselves are wrong.
Plausible Analytics ran a comparison study and found GA4 underreports engagement time by an average of 54.7%, and on some pages by 80%. That means the time GA4 shows you can be less than half of what really happened. The reason: GA4 leaves bounced visits out of its time math and treats tab-switching differently from tools that measure active focus time.
But the way GA4 counts is the smaller issue. The bigger one is who GA4 ever gets to see.
In the EU, GDPR requires cookie consent before Google Analytics can track anyone at all. Eight countries have ruled GA4 illegal outright. When the accept and reject buttons look equally inviting, as the law says they must, 60-70% of people in Germany and France press reject. A 2024 USENIX study found that banners with an equally visible reject button get a 34% rejection rate. In plain English: people say no when you let them.
The UK's Information Commissioner's Office is the country's own privacy regulator. After it put up a textbook, best-practice consent banner of its own, it lost 90.8% of its tracked traffic. From 119,417 tracked users a day down to 10,967. In other words, the regulator that writes the rules followed them and watched nine in ten visitors vanish from its own analytics.
Consent is only the start. Ad blockers strip out another 15-30% of GA4 data. Safari's Intelligent Tracking Prevention cuts cookie life to 7 days. Pile these on top of each other and the result is bleak.
There's a quieter problem underneath all of this: consent bias. The people who accept cookies aren't a random slice of your audience. They lean more engaged, more trusting, or from a different demographic than the people who decline. So GA4 isn't just missing volume. It's bent out of shape. Engagement rates look higher than they're. Bounce rates look lower. Your content data is tilted toward one unrepresentative corner of your audience.
GA4 Consent Mode v2 tries to patch the hole with behavioral modeling, but it needs 1,000+ daily events from both consenting and non-consenting users for 7 days straight before the modeling even starts. Most small and medium sites never clear that bar. And when it does run, it recovers around 70% of the lost attribution paths. The other 30% gets dumped into Direct traffic or simply disappears. In plain English: Google is guessing at the part it can't see.
The way out is plain, and it's the way I chose. Analytics tools that don't use cookies and don't collect personal data don't need consent in the first place. France's CNIL has cleared 23 analytics tools as exempt from cookie consent. These tools see 100% of visitors no matter their privacy settings, their browser, or what they tap on a banner. No sampling. No modeling. No gaps. Engagement data drawn from all of your traffic is a different thing entirely from data drawn from 37% of it. For the wider case on why GA4 is getting hard to defend in 2026, I wrote a separate piece on the legal, accuracy, and cost problems.
Here's what one visitor at a time looks like in Clickport. Every visitor is tracked, no cookie consent needed, and you can open up exactly what each person did on your site.
What good looks like
Theory is fine. Real numbers are better. Here are the three cases I point people to, teams that swapped traffic metrics for engagement metrics.
Wil Reynolds, founder of Seer Interactive, reported that his company lost 41% of its organic traffic in 2024. On a traffic dashboard that reads like a fire. But over the same stretch newsletter signups rose 65%, and revenue and leads held steady. Social drove 89% less traffic than search and still produced 20% more leads and 125 extra conversions.
His takeaway: "Take the stairs. Do the hard, human work of building trust, telling better stories, and creating content you'd actually stand behind in front of your peers." Traffic fell. The business grew. The traffic they lost was the traffic that never mattered.
Netflix moved its core content metric from counting 2-minute views to total hours watched. Along the way it found that 80% of streaming starts from homepage recommendations, not search. Switching the question from "did someone click" to "did someone stay" became the spine of its personalization engine and its biggest growth lever.
Grow and Convert built a whole agency on one finding: bottom-of-funnel content converts at 4.78% against 0.19% for top-of-funnel. They go after lower-volume, higher-intent keywords on purpose, and they count leads, not visits. Their clients see 150+ demo requests a month with 80% of pages ranking on page one.
The thread runs through all three. They stopped optimizing for reach and started optimizing for whether it landed. They measured the outcome, not the click.
Orbit Media's Content Performance Matrix gives you the simplest way I know to act on this. Plot every page on two axes, traffic and engagement, and you get four boxes:
- High traffic, high engagement (Pursue): Your winners. Lean in and make more like them.
- Low traffic, high engagement (Promote): Loved by the few who find it. Give it links, distribution, a push on social.
- High traffic, low engagement (Polish): Pulling people in who bounce. That's the intent mismatch. Rewrite it to match what searchers really came for.
- Low traffic, low engagement (Pass): Not earning its place. Merge it, redirect it, or retire it.
Most content plans look only at the top half, the traffic half. The engagement axis is where the real signal hides.
How to start measuring answers today
You don't have to rip out your whole analytics setup overnight. Here are the changes I'd make first, the ones that move the needle most.
Track scroll milestones. GA4 only auto-tracks scroll at 90%, which tells you next to nothing. It marks who reached the very bottom and stays silent on everything before it. Add events at 25%, 50%, and 75% instead. That means custom setup through Google Tag Manager, or a tool that tracks scroll depth on its own.
Set a time threshold that means something. GA4 calls a session "engaged" after 10 seconds. For a content site that's far too low. If your average post runs 2,000 words, 10 seconds is about 50 words read. Raise the threshold, or move to a tool that measures active focus time and pauses when the tab is in the background, rather than counting raw elapsed time.
Watch return visits. This is one of the hardest numbers to get right, and I won't pretend otherwise. Cookie-based tools drift because cookies expire, browsers block them, and people swap devices. Privacy-first tools that rotate identifiers each day can't see a cross-day return at all. The tradeoff is genuine: without cookies you get clean same-day accuracy or cross-day tracking, not both. If your tool does show return visitors, follow the trend. A return rate that keeps climbing means your content is building an audience.
Sort your content into the four boxes. Use pursue, promote, polish, pass. Pull your top 20 pages by traffic and check the engagement on each one: scroll depth, time, conversion rate. You'll almost certainly find pages pulling thousands of visits with engagement near zero. Those are your biggest openings.
Compare traffic sources by engagement, not size. A paid social channel sending 5,000 visitors at 12% engagement and 0.3% conversion is worth less than an organic channel sending 800 visitors at 68% engagement and 4.2% conversion. Look only at traffic and you'd back the wrong one.
The tools to measure all of this exist today. GA4 can do most of it with custom setup. Microsoft Clarity gives you free session recordings and a rough intent read. Privacy-friendly tools like Clickport track scroll depth, engaged time, outbound clicks, form interactions, copy detection, and downloads from the start, without cookies and without consent banners. You can also wire up custom goals to catch the exact conversion actions you care about, tied to engagement thresholds.
Here's what that looks like in practice. Clickport's Pages panel shows engagement next to traffic for every page, so the pursue, promote, polish, pass pattern jumps out at you.
The shift I'm arguing for isn't about buying new software. It's about asking a better question. Stop asking how many people came to your site. Start asking how many people got what they came for.
The first question hands you a number. The second one builds you a business.
Summary
The analytics business spent 20 years optimizing for clicks. 53% of people who hit a slow page bounce. 96.55% of published content gets zero traffic. 60% of searches end with no click at all. In plain English: the traffic game isn't just noisy. It's broken at the foundation.
Google already measures the thing that counts. NavBoost watches whether people are happy with your page. The IS score asks whether your content answered the question. AI search engines cite on depth, not rank. The platforms moved on years ago. Most dashboards never followed. If you've read this far, you're ahead of them.
The fix is concrete. Track scroll depth to see if people read. Track engaged time to see if they stayed. Track return visits to see if they came back. Track conversions per page to see what drives the business. Compare traffic sources by engagement, not by size. And make sure your tool sees 100% of your visitors, not the 37% who happened to tap "accept" on a banner.
Stop counting visitors. Start measuring answers.
If you'd like to see what your engagement data looks like from 100% of your traffic, do try Clickport free for 30 days. No cookies, no consent banners, no credit card. See how it works or read the full comparison with Google Analytics. I answer every email, so if your engagement numbers make no sense and you can't work out why, write to me.

Comments
Loading comments...
Leave a comment