Content Engagement Metrics: The Signals That Prove Visitors Actually Read Your Content
Show article contentsHide article contents
- The content measurement problem
- The signals hiding in every session
- The metric nobody measures: what visitors copy
- What copying actually tells you
- The gap between "visited" and "about to buy"
- Why engagement analytics cost $7,000 a year
- How copy detection works
- What copy data looks like in practice
- The privacy question
- What this changes for content teams
The average reader spends 26 seconds on a page. Less than half a minute. Your article got 4,200 pageviews and your dashboard called it a success, but 12 of those visitors copied a product name and left to comparison-shop somewhere else. Those 12 were your most valuable visitors. Your analytics had no idea they existed.
- Average engaged time on publisher sites is 26 seconds (Chartbeat Q4 2025). Pageviews tell you someone arrived. Engagement metrics tell you if they found what they came for.
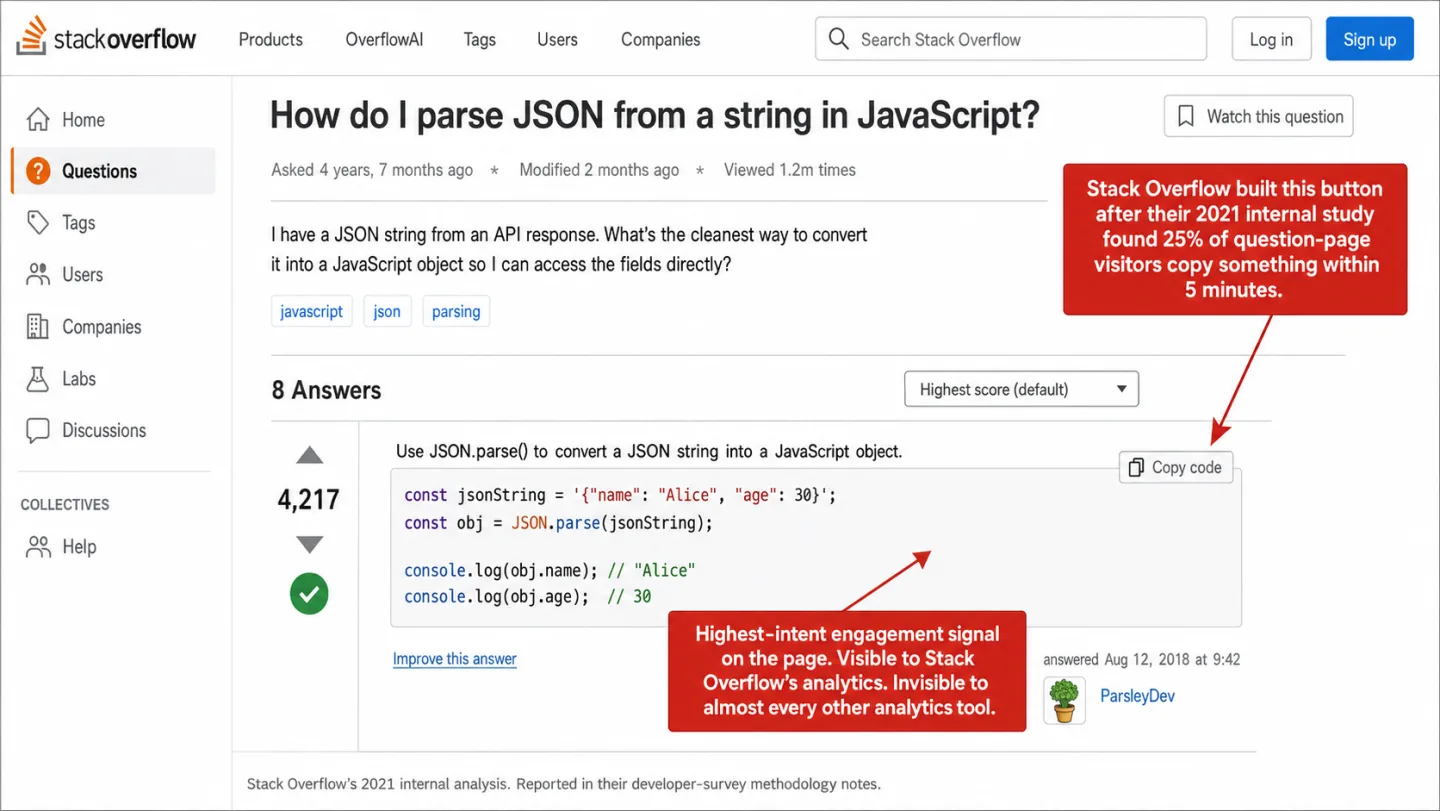
- On Stack Overflow, 25% of question visitors copy something within five minutes. On a software documentation site, 22% of visitors copied at least once. Copy events are the most direct signal that a visitor found something worth keeping.
- Enterprise engagement analytics (Chartbeat, Parse.ly, Contentsquare) start at $7,000 and scale to $170,000 per year. Small publishers who lost 60% of search traffic have no affordable tools to understand what's left.
- Copying a product name is a comparison shopping signal. Usability research shows shoppers copy product names to price-compare across sites. It is the strongest pre-click intent signal available to publishers.
- Combined engagement scoring (scroll depth + engaged time) gives each piece of content a quality number. Not 'how many people visited,' but 'did the content actually work.'
The content measurement problem
Content teams are flying blind. Pageviews tell you someone arrived. They do not tell you whether your content answered their question, whether they read past the second paragraph, or whether they found something worth acting on.
The numbers are brutal. Contentsquare's 2025 benchmark across 90 billion sessions found that bounce rates on paid social traffic were 9.2% higher than organic, brands increased digital ad spend by 13.2% while conversion rates dropped 6.1%, and pageviews per session declined. Their 2026 engagement data showed engagement dropping 10% year over year and time on site falling 7%. More people paying more to reach an audience that engages less.
More traffic. Less engagement. More money spent. Less return.
The global average engaged time is 26 seconds, according to Chartbeat's Q4 2025 data. Smartocto's benchmark across 343,000 articles from 231 brands found a median read depth of 44%. Less than half the article, on average. The standard dashboard shows none of this.
And it is getting worse. Small publishers lost 60% of search referral traffic over two years according to Chartbeat data reported by Search Engine Land. AI chatbots account for less than 1% of publisher pageview referrals, nowhere near enough to offset the drop. The traffic metric content teams have leaned on for twenty years is broken. When the traffic itself is disappearing, knowing what the visitors who remain do with your content stops being nice to have. It becomes the whole game.
The signals hiding in every session
Engagement is not one number. It is a handful of small behaviors, and each one tells you something different about what a visitor did with your content.
Scroll depth tells you how far someone got. If 80% of visitors stop at the third paragraph, the intro is working and the middle is not. If they keep going to the bottom, the content holds them. Contentsquare's 2026 benchmark found scroll rates fell 2% worldwide year over year, with desktop ahead of mobile at 50.5% against 45.2%. So half of desktop visitors scroll the page and fewer than half of phone visitors do. Scroll depth is the easiest engagement metric to measure and the one people ignore most.
Engaged time is not the same as time on page. Time on page counts every second the tab is open, including the 4 minutes the tab sat in the background while someone read email in another window. Engaged time only counts the seconds the visitor is really there. The tab loses focus and the clock stops. Chartbeat's methodology looks for a reader interaction in the last 5 seconds and ships the data to its servers every 15 seconds.
Outbound link clicks show which links visitors care about. On affiliate content, that click is the whole conversion. On a how-to piece, it tells you which sources your readers trust enough to follow. On a product page, it shows which outside reviews they go and check.
Form submissions show intent to convert. Someone who starts filling in a contact form is a different animal from someone who scrolls past it. The average cart abandonment rate is 70% according to Baymard Institute. That means only about 30 in every 100 shoppers who add something to a cart go on to buy. The signal is in the attempt, not only the finish.
Downloads show which files are worth saving to a hard drive. PDFs, spreadsheets, templates. A download is a small commitment. The visitor is saying this one is worth keeping.
And then there is the signal nobody bothers to track.
The metric nobody measures: what visitors copy
There used to be a company that measured this. Tynt, later renamed 33Across, was the biggest clipboard analytics service on the web. It watched copy behavior across about 500,000 websites. Its numbers showed that 2 to 6 in every 100 pageviews ended in a copy. Then the company walked away from clipboard analytics. The data went dark. And the metric dropped out of the industry's vocabulary.
The behavior never stopped. People copy text from websites all day long. What changes is the rate, and it swings hard depending on what the page is about.
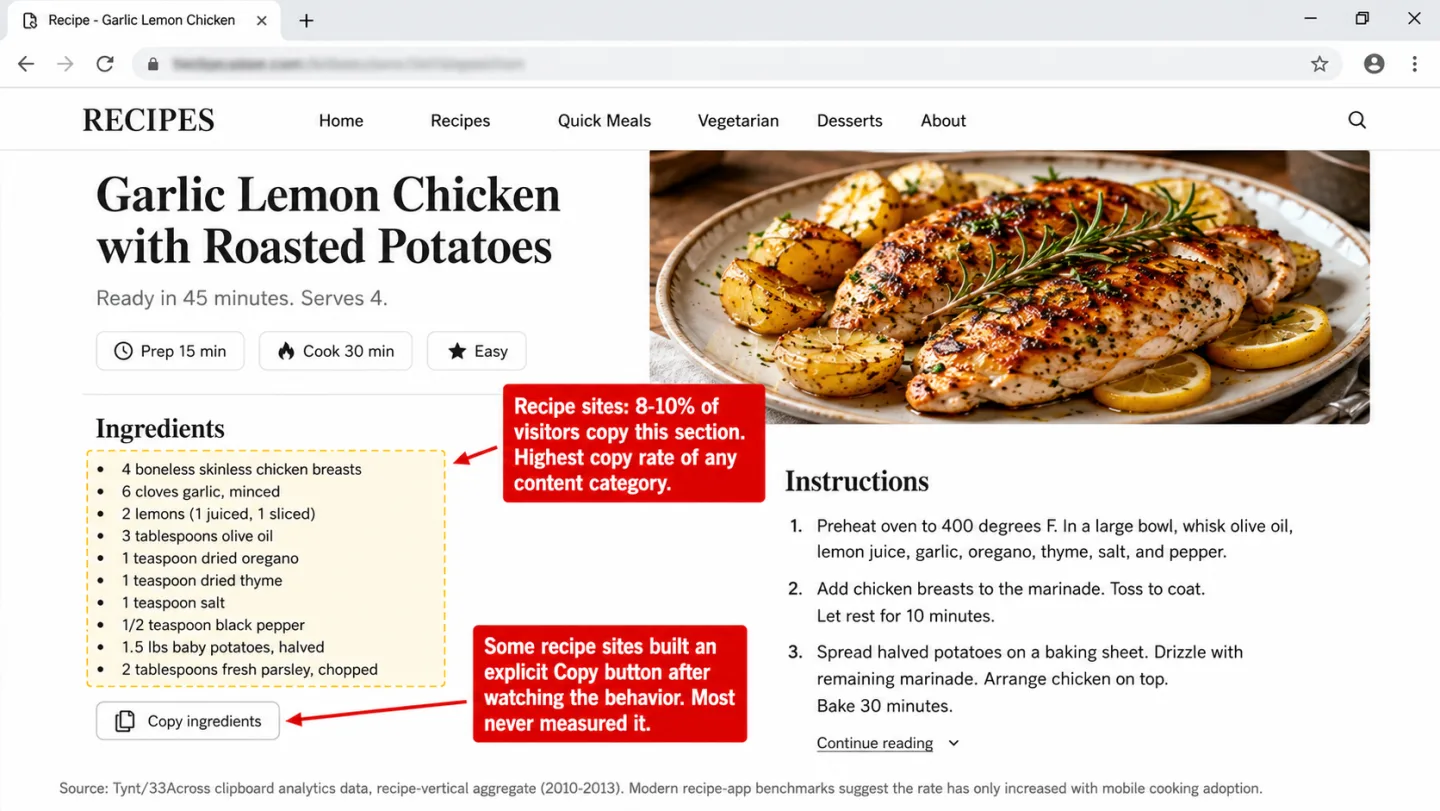
Stack Overflow's own 2021 study found that 25% of visitors to a question page copy something within five minutes. One in four. That number is what led them to build the "copy code" button. On a software documentation site, a 2020 academic study found that 22% of unique visitors copied at least once. More than one in five. On recipe sites, the ingredients list gets copied far more than anything else on the page.
Almost no analytics tool shows copy events as a metric you can read. PostHog offers an opt-in capture_copied_text feature, and FullStory stores copy events as data you can query. But no privacy-first tool tracks it, and nothing under $10,000 a year puts it on the dashboard with the copied text in plain sight.
What copying actually tells you
A copy event is more than an engagement signal. It is an intent signal. What someone copies tells you why they are on the page and what they are about to do next.
There is a name for what is going on here. Information foraging theory, set out by Pirolli and Card in 1999, says people forage for information the way animals forage for food. Copying text is hoarding. The visitor found something good enough to take home.
Cognitive psychology has a name for it too: cognitive offloading. You use an outside tool, in this case the clipboard, so you do not have to hold something in your head. Instead of trying to remember a product name, a price, or a quote, the visitor parks it on the clipboard. The clipboard turns into spare working memory. So a copy is, word for word, the visitor saying this is worth remembering.
For affiliate publishers, this is a big deal. A visitor who copies "Sony WH-1000XM5" out of your headphone review is comparison shopping right now. Usability research keeps showing that shoppers copy product names to check prices across sites, and they do it most for anything over $50. The clipboard is the bridge between your page and the buy.
And yet copy never made the list. In the standard set of micro-conversions that analytics tools track, text copying is missing. It shows up in no major framework's default metrics at all.
The gap between "visited" and "about to buy"
Affiliate publishers and content marketers have the same problem. There is a big measurement gap sitting right in the middle of the visitor journey.
Steps 2 and 3 are where a visitor turns from "someone browsing" into "someone about to buy." And you can barely see them. Most tools log the arrival at step 1 and maybe the outbound click at step 4 if you set it up. The affiliate network reports the purchase at step 6 hours or days later with almost no context. Everything in between is a black box.
This is not a small annoyance. It means content teams can only tune for traffic volume, never for conversion quality. They cannot tell which content formats drive purchases. They cannot tell a browser apart from a buyer.
Copy detection fills the hole at step 3. When a visitor copies a product name, a price, a coupon code, or a list of specs, they are telling you their intent. Not in a form field. Not in a click. In the plainest way there is: by deciding something on your page is worth taking with them.
Put it next to scroll depth (did they reach the recommendations?), engaged time (did they read the comparison?), and outbound clicks (did they follow through?), and copy events finish the picture that ties arrival to action.
Why engagement analytics cost $7,000 a year
If these signals are so useful, why isn't everyone tracking them?
Because for a long time, the only tools that measured engagement this well were built for big publishers with big budgets.
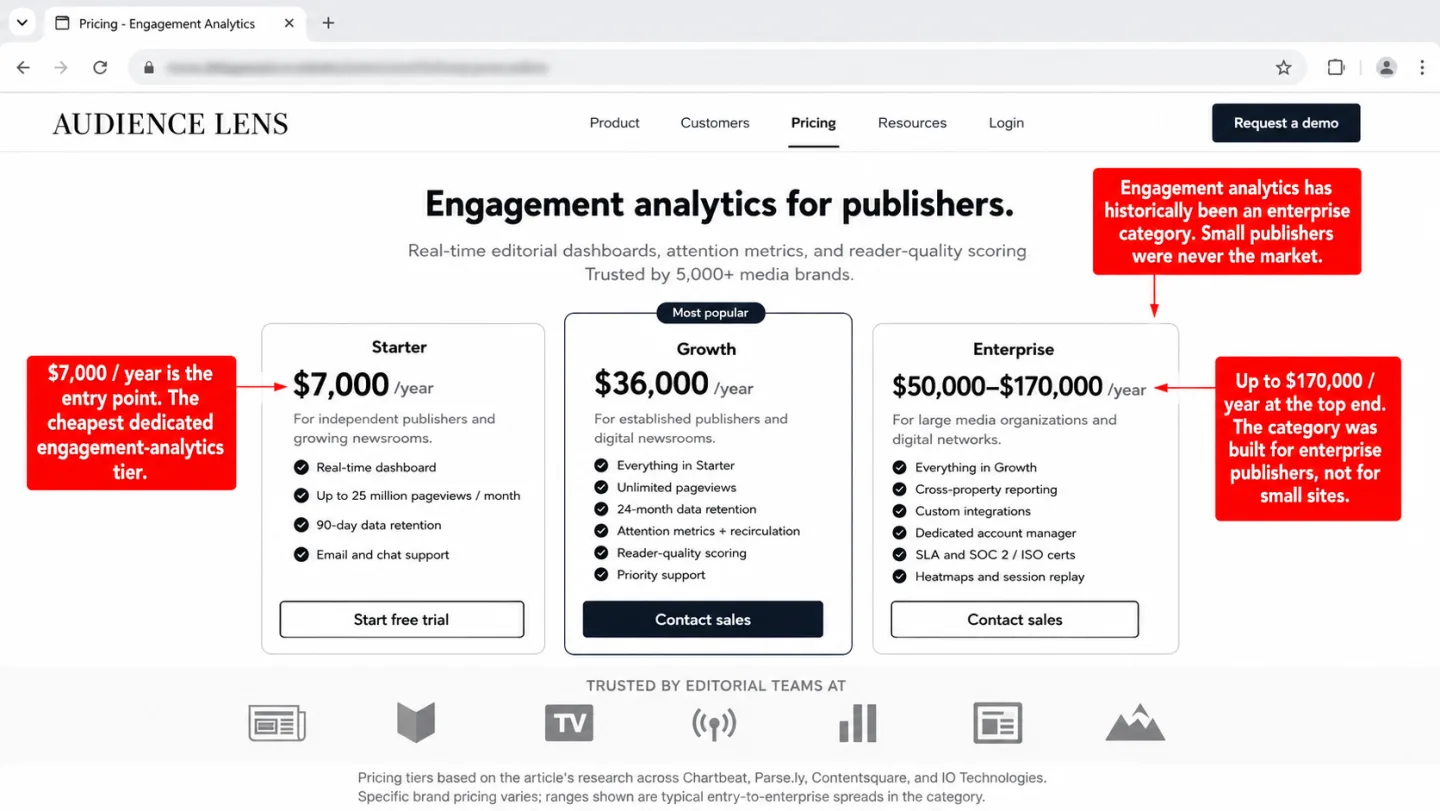
Chartbeat runs engagement analytics for 5,000+ media brands, the New York Times and Washington Post among them, and it starts at roughly $7,000 a year. Parse.ly, used by the Wall Street Journal and Bloomberg, starts at about $36,000 a year. A Contentsquare enterprise rollout runs from $50,000 to $170,000 a year.
That is the gap. The cheapest dedicated engagement tool starts around $2,000 a year. Now picture who needs this data. A blogger doing 5,000 pageviews a day. An affiliate publisher earning $3,000 a month. A SaaS founder trying to see which docs pages really help. Every one of them needs engagement data. Not one of them can pay for Chartbeat. And the tools they can afford, the $9 to $19 a month ones, do not even try to measure it.
And none of the big tools, at any of those prices, put copy events on the dashboard with the copied text right there to read.
How copy detection works
Copy detection runs on its own inside Clickport's 2 KB tracker script. There is nothing to set up. When a visitor copies text from your page, the event is caught and saved with the rest of their session.
One thing matters here. The tracker only sees a real copy, Ctrl+C, Cmd+C, or right-click then copy. It does not see plain text highlighting. Plenty of people drag-select text while they read and never copy a word. That habit, sometimes called "fidget highlighting," does not set off copy detection. You get the copies people meant to make, not the idle selecting. That keeps the data clean.
Copy detection only reads text from the site owner's own published pages. It cannot touch the system clipboard, other browser tabs, or anything in other apps. It is fenced to how visitors use the content you put out yourself.
![A screenshot of Chrome DevTools showing the Sources panel and Console panel for a tracker.js file, with three red editorial annotations. The Sources panel shows the file tree with tracker.js selected and the code editor displaying a 20-line vanilla JavaScript copy event listener that calls document.addEventListener('copy', ...), reads window.getSelection().toString(), filters out empty selections and text longer than 200 characters, and sends a fetch POST request to /api/event with the captured text and page path. Line 2 is highlighted with a red dashed border. The Console panel below shows captured events with selection.toString() outputting 'Sony WH-1000XM5' then '$278 at Amazon' followed by [Copy detected] log lines and the resulting JSON payloads. One annotation reads '12 lines of vanilla JS. The copy event has been in the browser since 2014.' A second reads 'Visitor copied Sony WH-1000XM5 then $278 at Amazon. Comparison shopping in real time.' A footnote reads 'Copy event support: Chrome (since 2014), Firefox (since 2014), Safari (since 2015). Specified in W3C Clipboard API Working Draft.'](/blog-assets/content-engagement-metrics-devtools-copy-event.webp)
What copy data looks like in practice
In Clickport's session drill-down, copy events show up as purple badges next to the page where the copy happened. Hover a badge and you see the copied text. Click it and the original page opens with the exact passage the visitor took lit up, using the browser's own text fragment API.
You can use the Signals filter to narrow the whole Sessions panel down to sessions where a copy happened, told apart from rage and dead clicks by a purple C badge. What you get is a list of your highest-intent visitors: the ones who found something worth taking with them. Look across those sessions and patterns come out. Which products get copied most? Which paragraphs? Which pages make copy events and which never do?
No amount of pageview data tells you any of that. If your comparison table gets copied more than your product descriptions, the table format is winning. If people copy the price but not the product name, they already know what they want and are just shopping on price. If nobody copies a single thing out of a 3,000-word review, the piece may be thorough but too vague to be useful.
The privacy question
Copy detection is a behavioral feature. It is fair to ask whether it belongs in a privacy-first tool at all.
Here is how I think about it. Copy detection reads the text a visitor selected from the site owner's own published page. It does not read the system clipboard. It cannot see passwords, private messages, or anything in other apps. The text it captures is text the site owner wrote and published in public. The visitor is using that content, and the owner gets to see which part they found worth keeping.
In that sense it sits right next to two things people already accept. Scroll depth, which records how far someone got down a page the owner controls. Outbound clicks, which record which of the owner's links the visitor followed. All three are behavioral signals. All three watch how a visitor used content the owner published.
The difference is that copy detection captures real text, not just a percentage or a URL. I am not going to pretend that is the same. The 200-character limit is there to keep it small. And the tracker only fires on pages where the owner installed it, capturing text the owner already has.
Clickport does not use cookies. It does not fingerprint. It does not follow you site to site. The copied text is stored with the session for the site it happened on, and only the site owner can see it. Nothing goes to a third party. The whole thing runs on EU-hosted infrastructure, and no data leaves Europe.
I think copy detection is a fair engagement metric, for some sites. Reasonable people can draw the line somewhere else. I would rather tell you exactly what it does than bury it in a privacy policy nobody reads.
What this changes for content teams
Put copy detection together with scroll depth, engaged time, and click tracking and you get something that did not exist at a price normal people pay: a full picture of how visitors use your content.
Not "how many people came." Not "how long was the average session." Just one question. Did the content work?
For affiliate publishers: You see which products visitors copy before they click through to Amazon. The copy comes before the click. It tells you the visitor is comparison shopping and which product caught their eye. If your most-copied product is not your most-clicked product, your content is creating interest that your link placement is dropping on the floor.
For SaaS documentation: You see which code blocks visitors copy. A getting-started guide with high scroll depth but low copy rates means people are reading and not building. If one code snippet gets copied in 25% of sessions, that snippet is why people came. Promote it. Make it easy to find.
For content marketers: You see which quotes, stats, and passages visitors keep. The passages that get copied are the ones worth growing into their own posts. They are the hooks that landed. If one data point in a 4,000-word article pulls most of the copies, that data point is the article.
For e-commerce: You see which products visitors research before they buy. Copies of product names, prices, and SKUs are the clearest comparison-shopping signals you can get. They tell you which products people are seriously weighing, not just which ones got an impression.
Every one of these signals is invisible in a standard dashboard. Every one of them has lived in the browser's event model for over a decade. The gap was never a technical one. It was that nobody built an analytics tool that bothered to listen.
Clickport tracks all of it: scroll depth, engaged time, outbound clicks, form submissions, downloads, 404 errors, and copy detection. Everything is in every tier, starting at EUR 9/month. No feature gates. No enterprise upsell. No cookies, no consent banners, no data leaving the EU.
If you have been judging your content by pageviews, you have been measuring the wrong thing. The signals that tell you whether your content works have been there the whole time. You just need a tool that listens for them.
Start your free trial
30 days free. See scroll depth, time on page, and engagement scores instantly.

Comments
Loading comments...
Leave a comment