How to Send Your Client an Analytics Report in 60 Seconds
A client report takes 2-2.5 hours in GA4. The client reads it in two minutes. That's the trade you make every month, hours of assembly for a glance. It doesn't have to be that way. The same report can take one click and sixty seconds.
The usual note before we start: I build Clickport, the tool in the second half of this piece, so I'm biased and you should know it going in.
- Marketers spend an average of 3.55 hours per week collecting and organizing analytics data. Manual client reports take 3-5 hours each.
- 38% of agencies report clients favor static reports over live dashboards or meetings. They want something they can read without logging in.
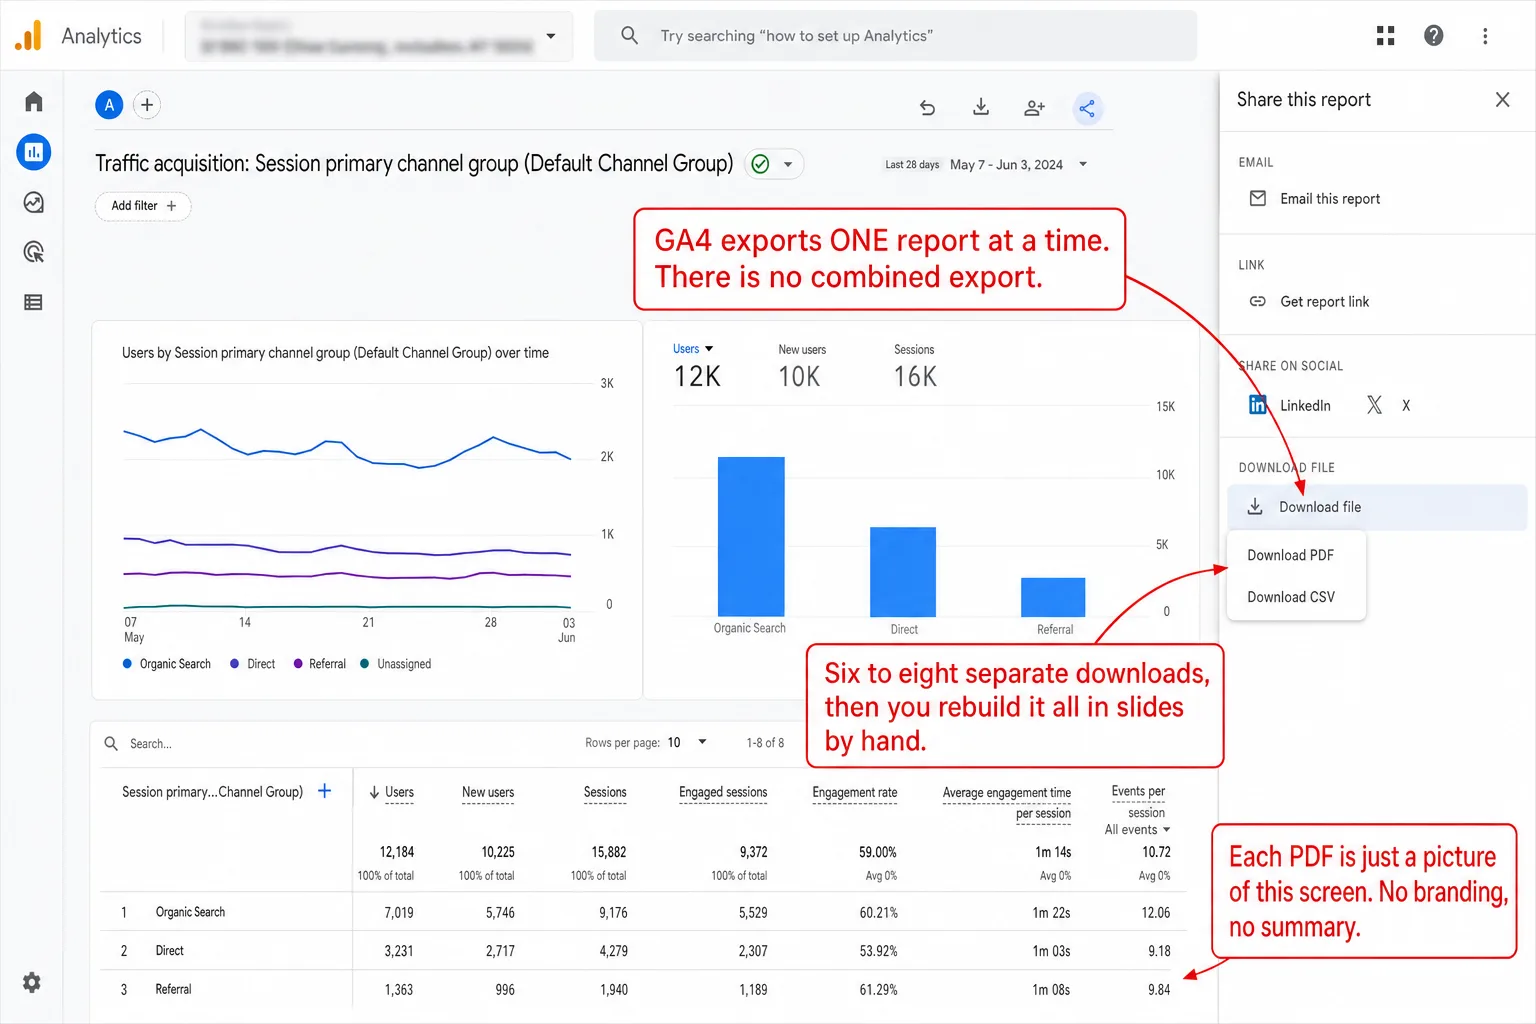
- GA4 has no combined export. You visit 6-8 separate reports, export each one, then manually assemble them into a presentation.
- A one-click 3-page PDF with 8 KPIs, top 15 sources, top 15 pages, and geographic breakdown eliminates the screenshot-paste-format cycle.
- Share links give clients live, read-only dashboard access. Up to 10 per site, revocable instantly, no accounts or passwords needed.
The problem with reporting from GA4
GA4 has no combined export. To build one client report you open at least 6-8 separate report screens: Traffic Acquisition, User Acquisition, Events, Pages and Screens, Demographics, Tech Details, and sometimes Explorations. Each screen wants its own date range, its own filters, its own export. There's no one button that pulls them together.
Every export comes out as its own file. The PDFs are plain screenshots of the GA4 interface, with no branding, no custom formatting, and no executive summary anywhere. The CSVs need a spreadsheet just to make sense of.
Then the real work starts. You copy numbers into slides, rebuild the charts, work out the period-over-period changes by hand, and write the commentary. The whole thing runs 2-2.5 hours per client. In practice, put that across 8 clients and you've spent a full work week on reporting, every single month.
And all of that's before you account for GA4's 24-48 hour data delay. In practice, the numbers can take a day or two to settle, so you might be reporting on data that isn't even complete yet. And you would never know.
What clients actually want in a report
Here's the disconnect. You spend hours building a thorough, comprehensive report. And research from AgencyAnalytics shows clients ignore the reports that are stuffed with too many metrics. Small business owners track 10 or fewer KPIs, and almost half of them watch only 1 to 5. In plain English: the more you pack in, the less they read.
So what do they care about?
- Where are visitors coming from? Which channels are working.
- How many conversions? Form submissions, purchases, signups.
- Are things trending up or down? Comparison to last period.
- What pages are getting traffic? Especially their key landing pages.
That's the whole list. 38% of agencies report that their clients favor static reports they can read on their phone. That means nearly four in ten agencies say their clients would rather have a file they can open than a tool they have to log into. Not a live dashboard. Not a 20-page slide deck. A clean visual summary they can glance at in two minutes, and then get on with their day.
The 60-second report
I built Clickport's report as a byproduct of the dashboard. You don't build it. You export it.
Step 1. Open the client's site in your dashboard. Pick the date range.
Step 2. Click the export button. Choose PDF.
Step 3. A 3-page PDF downloads on the spot. Attach it to an email. Done.
That 3-page PDF holds everything a client needs:
The report answers every question I've seen a client ask. How are we doing? Where is the traffic coming from? Is it growing? Which pages are working? Which countries? What devices? Every number sits next to a comparison arrow that tells you which way it moved.
No slides. No screenshots. No formatting. One click.
When your client wants the spreadsheet
Some clients want the raw numbers. Maybe they have their own reporting templates. Maybe their finance team needs the data in a particular shape. Either way, you don't want to retype anything.
Click export, choose CSV. You get a ZIP file with 18 CSV files sorted into 9 folders: traffic, pages (including entry pages, exit pages, and 404s), sources (by channel, by source, by referrer), geography (countries, regions, cities), technology (devices, browsers, OS, screens), campaigns (all five UTM parameters), goals, and sessions. In other words, that's the whole site, broken out, ready to drop into whatever template they already use.
Every file respects the date range and filters you've set. Every number is raw and ready for a spreadsheet. The filename carries the date range, so they archive cleanly.
For a monthly reporting workflow that comes down to four steps: open the client site, pick "Last 30 days," click CSV, email the ZIP. Under a minute.
Skip the report entirely
There's an option most analytics tools don't give you at all: a share link. I built it because a monthly PDF shouldn't be the client's only window.
In Clickport, you can create a share link for any client site. It builds a unique URL with a token nobody can guess. Send that link to your client and they see a live, read-only version of the full dashboard. No account. No password. No onboarding call.
They can check their traffic whenever they like. They can change the date range, apply filters, open any panel. The one thing they can't do is change anything: no settings, no new goals, no edits. They look, they don't touch.
This kills the "can you send me the numbers?" email for good. Your client has the numbers whenever they want them. You still send the monthly PDF as a tidy summary, but between reports they serve themselves.
When a project ends, revoke the link. The access is gone the moment you click.
Better data without the cookie headache
There's a deeper problem under all the reporting effort. Cookie consent banners hide 60-70% of your visitors from analytics tools that need consent to count. Which means if your client's site runs GA4, the majority of their traffic is simply missing. Two out of every three visitors don't show up. You report on what is left, and neither you nor your client realizes how much is gone.
Clickport uses no cookies. So there's no consent banner to hide behind. 100% of visitors are tracked, the ones who block cookies and the ones who reject consent included. The numbers in your report are the real numbers. Not a sample. Not a filtered subset. Everyone who visited.
For EU clients there's a bonus. You're no longer wrangling a cookie management platform, configuring a banner per client, or sitting through a GDPR compliance audit. One 2 KB script tag per site, and that's the entire setup. The script is a fraction of GA4's size, so your client's Core Web Vitals get a little faster on the way in.
Try it with one client
You don't have to move all your clients over at once. Just pick one. Start a free trial, add their domain, paste the script tag, and export your first PDF.
If that one report saves you the 2 hours it used to cost, you'll know soon enough whether the rest of your clients belong here too.
Setup takes under 2 minutes. The first report takes under 60 seconds. The math does the convincing for you. And I answer every email, so if a client asks for something the report doesn't cover, write to me.

Comments
Loading comments...
Leave a comment