GA4 Consent Mode Modeling: The Numbers Google Invents
Show article contentsHide article contents
- What consent mode modeling is
- How GA4 invents your declined visitors
- The 70% number is from 2021, and it isn't about GA4
- You can't tell a modeled number from a real one
- How you'd even know: the BigQuery test
- Small sites get nothing: the fourth failure mode
- Hides, estimates, invents: GA4's three ways to not give you the real number
- Is it even legal to model people who said no?
- Analytics with nothing to model
- Frequently asked questions
- A number you can't check isn't a measurement
A visitor declines your cookie banner. You'd assume GA4 just doesn't count them. What actually happens, if your site is big enough, is stranger: GA4 estimates what that person would have done from the people who did consent, and files the guess in your reports next to the real numbers, with no way to tell them apart.
That's consent mode modeling, and it's the third way GA4 hands you a number that isn't quite real. It hides your small rows, it estimates your big ones, and here it invents the ones it never saw. This one is the quietest of the three, because the invented numbers look exactly like the real ones.
- Consent mode modeling is GA4 using machine learning to invent the behavior of visitors who declined your cookie banner. It estimates their sessions and conversions from the people who did consent, then blends the invented numbers into your normal reports.
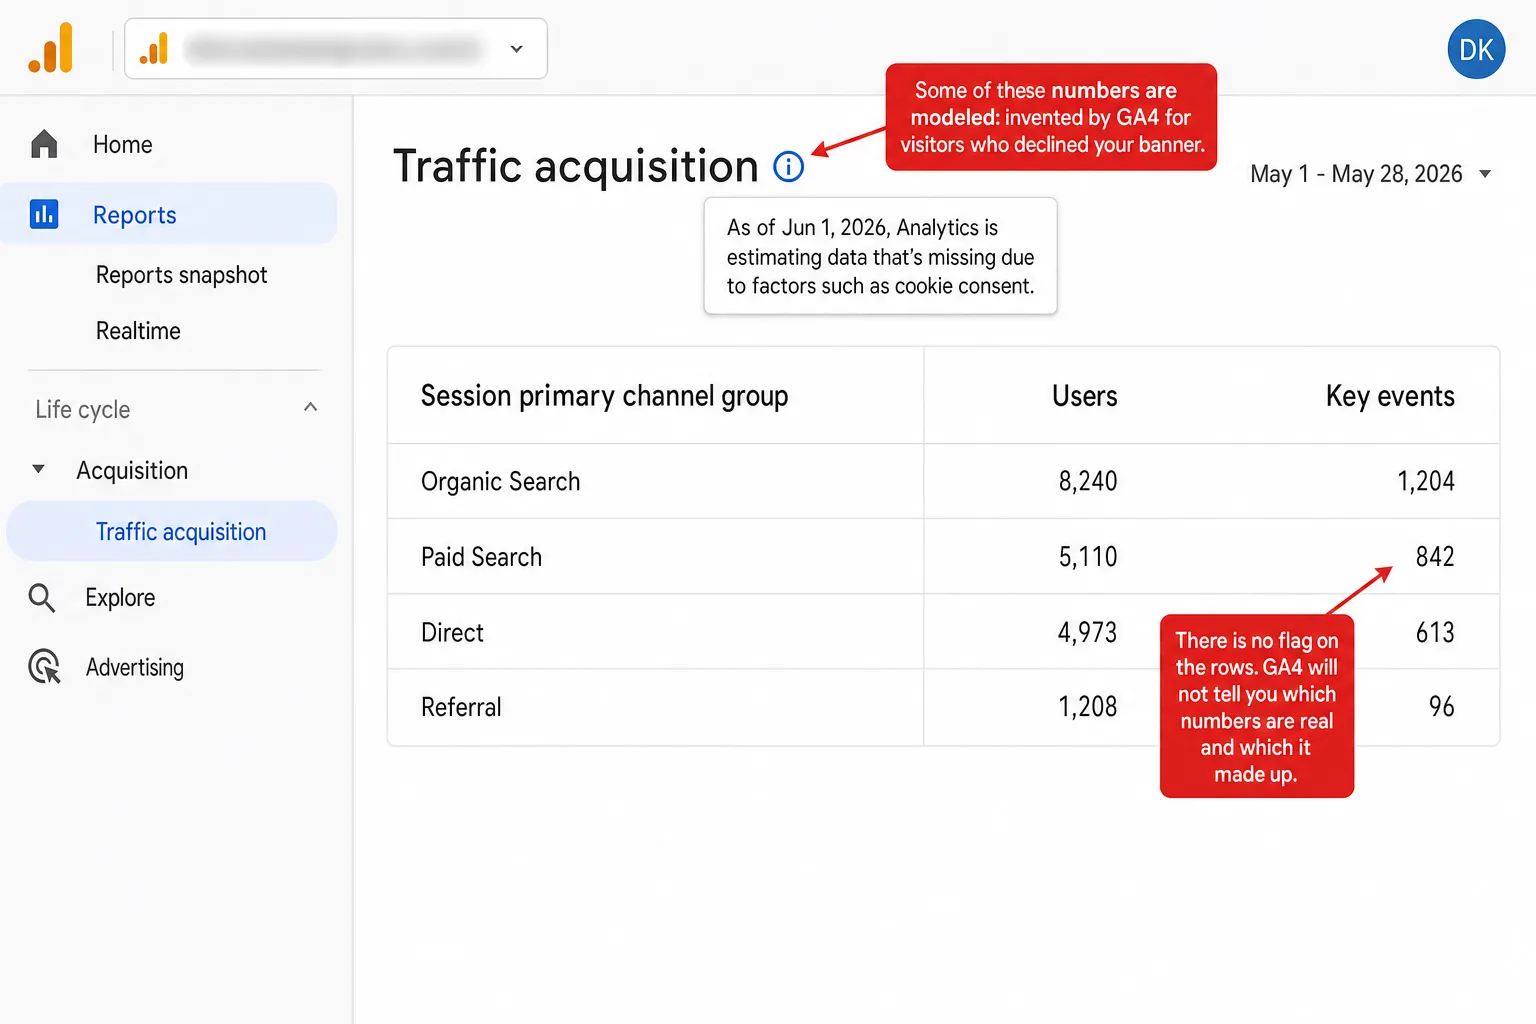
- There is no way to tell a modeled number from a real one. GA4 shows a single report-level note that it is 'estimating data that's missing due to cookie consent,' but no per-row flag. Its reports use 'a mix of observed data where possible and modeled data where necessary.'
- The '70% accurate' figure everyone cites is from a Google blog post dated April 2021. It describes Google Ads conversion modeling, not GA4's own behavioral modeling, which has no published accuracy number at all. No independent audit of it exists.
- Modeling only switches on above a high traffic floor: roughly 1,000 declined events and 1,000 consented users a day, sustained. Below it, GA4 invents nothing. It drops the declined visitors and files their conversions under 'Direct.'
- You can check GA4's homework in one place. Google confirms 'none of the modeled data is available' in the BigQuery export, so the raw data disagrees with the dashboard, and that gap is the modeled layer. A cookieless tool has no banner and no declined visitors, so there is nothing to model.
What consent mode modeling is
Consent mode is how GA4 keeps measuring when a visitor says no to cookies. When someone declines, Google's tags don't just go dark. In the setup Google recommends, they keep firing, only without cookies, and GA4 fills the resulting gap with a model.
There are two flavors, and the difference matters. In Consent Mode Basic, the tags are blocked until the visitor interacts with the banner, and if they decline, nothing is sent to Google at all. In Consent Mode Advanced, the tags load immediately and, when consent is denied, send what Google calls cookieless pings: hits with no cookies and no identifiers, carrying only generic signals like the user agent, the screen resolution, and an IP address Google says it doesn't store. No individual, just a shape.
Those pings are the raw material. GA4 counts them, notices they don't add up to what it usually sees, and models the difference. The model is what this article is about.
How GA4 invents your declined visitors
Behavioral modeling works by training a machine on the visitors who did consent, then using it to guess what the ones who didn't would have done. Sessions, engagement, conversions: all estimated from the consenting crowd and stamped onto the silent one.
Simo Ahava, one of the most-cited people in this field, described it more honestly than Google does: the unconsented data goes through "a modeling process where it's shaped and molded to look like the real thing (data collected from consenting users)." Read that twice. The declined visitor's data isn't recovered. It's reconstructed to resemble somebody else.
Google's own description of the machinery is matter-of-fact. It uses holdback validation: it hides a slice of real data from the model, lets the model predict it, then checks the prediction against what it hid. The goal, in Google's words, is "preventing over-prediction." That's an important detail, and I'll be fair about it. The model is tuned to under-count rather than inflate. So this isn't a story about GA4 padding your numbers with fake wins. It's a story about GA4 blending in numbers you can't identify, can't verify, and didn't observe.
The 70% number is from 2021, and it isn't about GA4
Every defense of consent mode leans on one figure: it recovers "more than 70%" of what you'd otherwise lose. I went looking for where that number comes from, because a single unaudited statistic is doing an enormous amount of work. Here's what I found.
The 70% comes from a Google Marketing Platform blog post with a publish date of April 15, 2021. Its exact words: "on average, conversion modeling through Consent Mode recovers more than 70% of ad-click-to-conversion journeys lost due to user cookie consent choices." Three things about that sentence should change how you read it.
Marketers repeat "70% accurate" as if it describes the numbers on their GA4 dashboard. It doesn't. It was measured on Google Ads conversion recovery, in 2021, by Google, and nobody outside Google has ever checked it. GA4's own behavioral modeling, the thing filling your reports, ships with no accuracy figure at all. When I ask what evidence says the invented numbers are close to reality, this five-year-old sentence is the entire answer.
You can't tell a modeled number from a real one
Here's the part that should bother you most. GA4 gives you no way to separate the modeled numbers from the observed ones. They sit in the same rows, in the same reports, looking identical.
Google is open about this if you read the right page. Its docs say GA4 reports attribute events "based on a mix of observed data where possible and modeled data where necessary." The word "mix" is doing a lot of work. There's no column, no asterisk, no per-row marker. The only signal anywhere in the standard interface is a single report-level note, and even that is easy to miss: hover the data-quality icon and it says "Analytics is estimating data that's missing due to factors such as cookie consent." That's it. Something in this report is modeled. Good luck working out what.
It gets slipperier. Modeled data quietly drops out of certain views: build an audience, open a retention report, or use a sequence-based segment, and the modeled numbers vanish. So the same metric can change depending on how you look at it, not because reality changed, but because you left the zone where GA4 was willing to guess. A number that moves depending on how you slice it isn't a measurement. It's a mood.
How you'd even know: the BigQuery test
There is exactly one place GA4 will show you its homework, and almost nobody looks. The raw BigQuery export contains only observed events. In Google's own flat words: "None of the modeled data is available in the BigQuery event export."
Think about what that means. The dashboard has modeled data blended in. The export doesn't. So your BigQuery totals won't match the GA4 interface for the same dates. For conversions and events, the dashboard runs higher, because the modeled numbers are piled on top of the observed ones. (For a metric like active users it can even flip, since BigQuery counts every consentless session as a new person.) Either way, the two disagree, and that disagreement is the modeled layer, the only way to measure your own modeled volume, and it takes a data warehouse to see.
Sit with the shape of that. The one number that's real, the observed count, is hidden in a developer tool most marketers never open. The number that's part-invented is the one on the screen everybody actually uses. Google put the honest figure where you won't find it and the modeled figure where you will.
Small sites get nothing: the fourth failure mode
Now the twist that the "GA4 makes up your numbers" crowd usually skips, and it's the one I care most about. Modeling doesn't happen for most websites at all. It has a traffic floor, and it's high.
For GA4 behavioral modeling to switch on, Google requires the property to collect "at least 1,000 events per day with analytics_storage='denied' for at least 7 days" and "at least 1,000 daily users sending events with analytics_storage='granted' for at least 7 of the previous 28 days." And meeting those isn't even a guarantee: Google adds that hitting the thresholds "doesn't guarantee eligibility." Most sites don't come within an order of magnitude. A 2019 BrightLocal study of over 11,000 local-business sites found 55% get under 500 monthly users. The floor asks for 1,000 declined events a day.
So below the line, GA4 doesn't invent your declined visitors. It does something quieter and, for a small site, worse: it drops them. Their sessions vanish, and in GA4 their conversions get attributed to the "Direct" channel, the same bucket where every other unattributed and lost visit already piles up. No banner tells you. Your report just quietly understates your best channels and inflates Direct. Check whether your site is above or below the line:
Two visitors, two different fates, decided by nothing but your traffic size. On a big site, the person who declined becomes a machine's guess. On a small site, they become a rounding error in your Direct channel. Neither one becomes a fact.
Hides, estimates, invents: GA4's three ways to not give you the real number
I've now written this same article three times, about three different mechanisms, and it's worth laying them side by side, because together they're a pattern. GA4 has three ways of showing you a number that isn't the observed truth, each triggered by a different condition, each invisible unless you go looking.
| Mechanism | What it does | When |
|---|---|---|
| Thresholding | Hides low-user rows for privacy | Signals + demographic data |
| Sampling | Estimates from a subset | Query over 10M events |
| Consent modeling | Invents declined visitors | Consent denied, above the floor |
Thresholding gives you an empty row. Sampling gives you a fuzzy one. Consent modeling gives you a full, confident, invented one. In every case the report looks normal and the caveat is buried. If you've read the other two pieces, you already know the shape of my complaint: none of this is a bug. It's how GA4 is built, because GA4 is built to keep advertising numbers flowing even when measurement breaks, and a modeled number keeps the machine fed better than a missing one.
Is it even legal to model people who said no?
This is the question I can't shake. A visitor read your banner and declined. GA4's answer is to model their behavior anyway, from other people, and use it. Is that allowed?
Honestly: nobody official has ruled. Consent Mode v2 became mandatory for European advertisers in March 2024, tied to the Digital Markets Act deadline, and adoption is now near-universal. But no data protection authority, and not the EDPB, has issued a decision on whether inventing the behavior of someone who declined consent is itself lawful. A 2025 peer-reviewed paper argues it strains the GDPR's fairness principle, the idea that people shouldn't have their data used in ways they wouldn't expect, and declining a banner is a fairly clear signal of what you expect. That argument is live, not settled. I'm flagging it, not claiming it.
I'll route the full legal picture to where it belongs. If you want the deeper version, I keep it updated here. For this article the point is narrower: the modeling sits on ground nobody has tested, built on data from people who explicitly opted out.
Analytics with nothing to model
The reason consent mode modeling exists is that GA4 needs cookies, cookies need consent, and consent gets declined. Every step of that chain is a choice Google made. The model is what you build when the whole thing depends on data people keep refusing to give.
Clickport doesn't have the chain. It's cookieless, so there's no banner to decline. Every visit is measured the same privacy-respecting way, whether the visitor would have clicked "accept" or "reject," because there's no cookie to accept or reject in the first place. There's no consented group and no declined group. There's just what happened, counted once.
So there's nothing to model, because there's no gap to fill. I want to be precise about that claim, the way I've tried to be about Google's. Clickport isn't magic. But it never invents a visitor, never reconstructs one person's behavior from another's, and never blends a machine's guess into a number and hides which is which. When a Clickport report shows 613 conversions from Direct, every one is a real event it logged, not a machine's guess about someone who opted out. There's no observed-plus-invented blend, because there's nothing to invent.
None of this makes GA4 useless for trends. But when the number in front of you might be observed, might be modeled, might be missing entirely, and GA4 won't say which, you should at least know that before you make the call. Most people don't. Now you do.
Frequently asked questions
What are modeled conversions in GA4? They're conversions GA4 didn't observe, estimated by a machine-learning model from the visitors who did consent to cookies, then blended into your reports. When someone declines your banner, GA4 can't track them directly, so above a certain traffic level it models what they probably did and counts the guess.
Is Google consent mode data accurate? Nobody outside Google knows. Google's only published figure, "more than 70%" recovery, is from 2021, is about Google Ads and not GA4, and has never been independently audited. GA4's own behavioral modeling has no published accuracy number at all. The models are tuned to avoid over-predicting, so the likelier error is under-counting real events, not inflating fake ones.
Does consent mode inflate conversions? Not by design. Google says its models are built to prevent over-prediction, so they lean toward under-counting. The problem isn't that the numbers are too rosy, it's that part of them is invented and you can't tell which part, or check it without exporting to BigQuery.
How do I know if my GA4 data is modeled? There's no per-row flag. The only in-product signal is a report-level tooltip on the data-quality icon reading "estimating data that's missing due to factors such as cookie consent." To measure how much is modeled, export your events to BigQuery, which contains only observed data, and compare the totals to the GA4 interface.
Do small sites get behavioral modeling? Usually not. GA4 requires roughly 1,000 declined events and 1,000 consented users per day, sustained for at least a week, and even that isn't a guarantee. Below the floor, GA4 doesn't model declined visitors, it drops them, and attributes their conversions to the Direct channel.
Can I turn off consent mode modeling? Partly. Switching your Reporting Identity from Blended to Observed or Device-based stops modeled data from appearing in your reports, at the cost of Blended's cross-device stitching. The BigQuery export is also modeled-free, since it holds observed events only. What you can't do is stay in a Blended report and see which specific numbers were modeled.
A number you can't check isn't a measurement
Consent mode modeling is the most polished of GA4's three ways of not telling you the truth. Thresholding leaves a blank you can see. Sampling waves a little flag. Modeling leaves nothing at all: a clean, confident number, part observed and part invented, with the seam sanded smooth.
And the whole thing rests on one five-year-old statistic about a different product that no independent party has ever checked. That's not measurement. That's trust, dressed as data, in a tool that has already shown you three times over that it would rather hand you a guess than admit a gap.
Clickport measures what happened, to everyone, without a banner to decline or a model to fill. You can try it free, and when a number goes up, it's because a real person did a real thing, not because a model decided they probably would have. And if you want the whole map of where GA4's numbers come from, I put it here. I answer every email, so if your GA4 reports and your gut keep disagreeing, write to me.

Comments
Loading comments...
Leave a comment