GA4 Data Thresholding: The Rows Google Hides From You
Show article contentsHide article contents
- What GA4 data thresholding is
- How much of your data lives below the line
- What triggers GA4 thresholding
- Why Google hides the rows, and why it isn't wrong to
- The 50-user line Google won't confirm
- Thresholding vs sampling vs (other) vs (not set)
- How to get your data back, and what each fix costs
- Why smaller sites lose the most
- The rows it hides are the ones you need
- Analytics that never hides a row
- Frequently asked questions
- You paid to collect it. You should get to see it.
You open a GA4 report and half the rows are just gone. In their place: an orange warning triangle and a sentence about thresholds you can't change. That's data thresholding, GA4's privacy feature that hides any row with too few users. It sounds small. On a normal site it isn't, and I've got the numbers.
Thresholding is one of four different ways GA4 keeps your own data off your screen, and it's the one Google is proud of. It's there to protect privacy, which is a real and decent goal. The trouble starts with what "too few users" turns into once you count the rows on a real website.
- GA4 data thresholding hides any report row with too few users, roughly under 50 by most practitioner estimates, to stop you identifying individuals. The exact number is set by Google, undisclosed, and you cannot change it.
- It fires when Google Signals is on and a report touches demographic, audience, or search-query data, in every Exploration, and in Looker Studio. Charles Farina showed one top-pages report drop from 207 rows to 4 with Signals turned on.
- I checked traffic across Clickport customer sites. On the median site, 89.5% of traffic-source rows, 97.4% of page rows and 93.8% of country rows sit below the 50-user line. Even at a conservative 10 users, 69% to 87% still fall under it.
- The hidden rows are your long tail: the new country, the emerging referrer, the post just starting to work. They are about 90% of your rows but often under 6% of your traffic, so you lose your discoveries, not your totals.
- No GA4 setting fully fixes it. Disabling Google Signals costs you demographics and cross-device reporting, GA4 360 at roughly $50k to $150k a year does not remove thresholding, and only a raw BigQuery export escapes it. A cookieless tool has nothing to threshold.
What GA4 data thresholding is
Data thresholding is GA4 hiding a report row when the number of users in it drops below a minimum Google sets and won't tell you. The stated reason is privacy: with few enough people in a row, someone could work out who they are.
Here's Google's own wording, from the About data thresholds help page: "Data thresholds are applied to prevent anyone viewing a report or exploration from inferring the identity or sensitive information of individual users based on demographics, interests, or other signals present in the data." And the part that matters most for you: "Data thresholds are system defined. You can't adjust them."
So you can't turn a dial. You can't raise or lower the bar. Google decides, and Google doesn't publish the number.
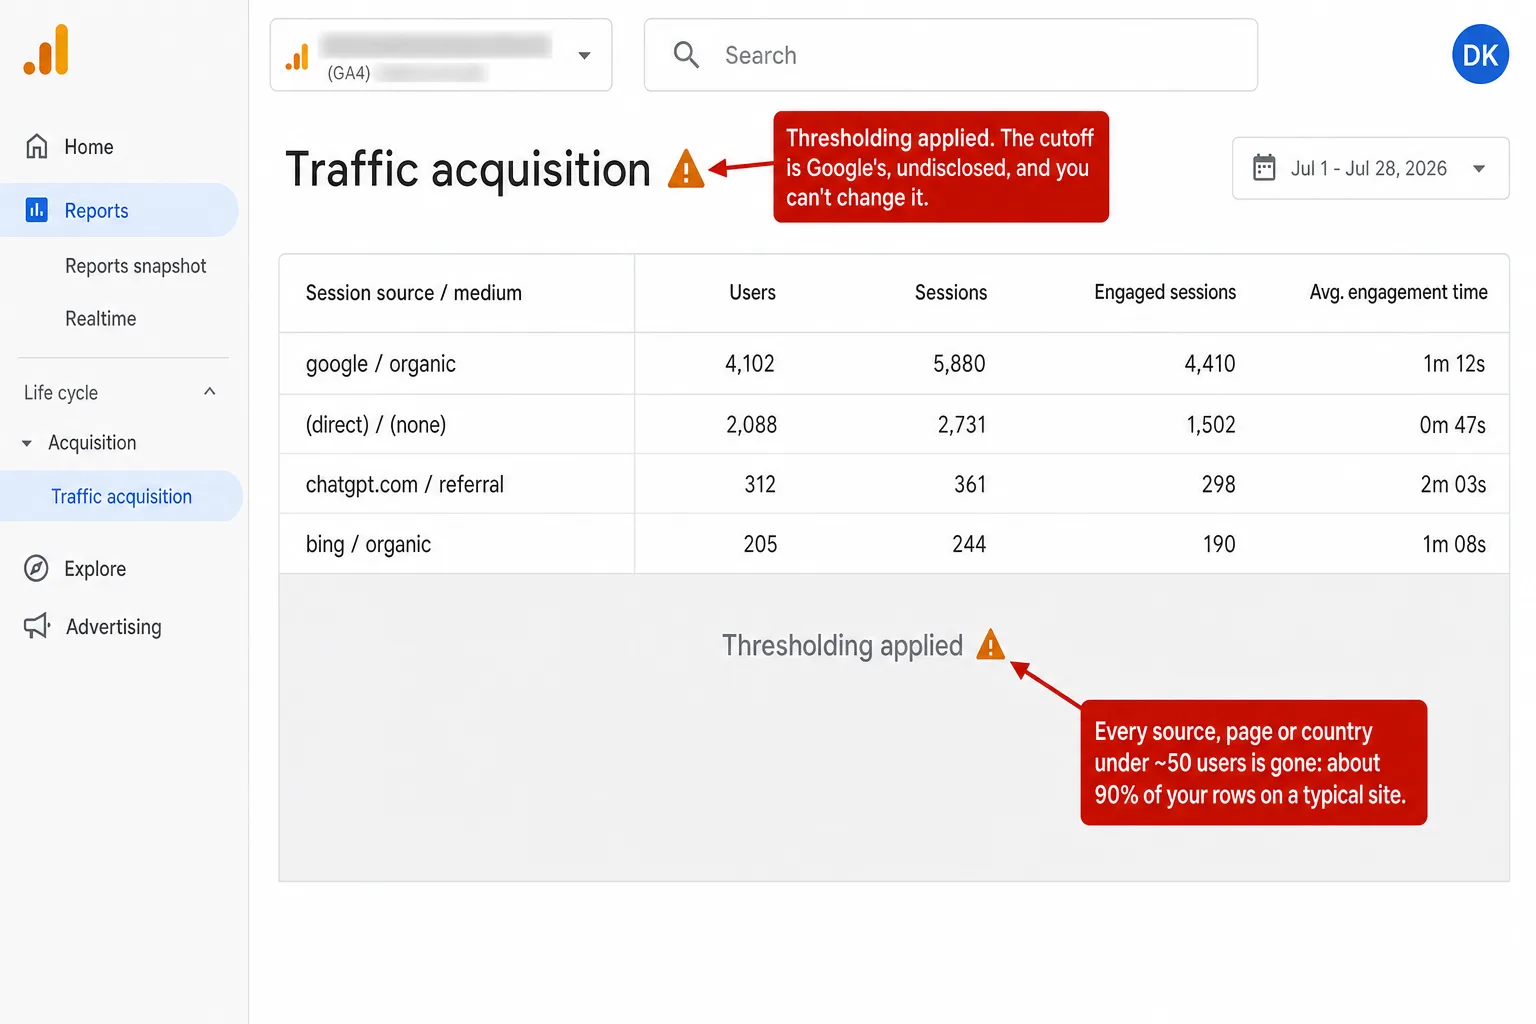
When it kicks in, you get the orange triangle. Hover it and GA4 says: "Google Analytics has applied thresholding to one or more cards in this report and will only display the data in the cards when the data meets the minimum aggregation thresholds." The compact label is just "Thresholding applied." It shows up next to a report's title, in the top-right of overview cards, and in the corner of every Exploration.
Notice what the warning doesn't tell you. Not which rows it dropped. Not how many. Not the cutoff. Just that some data is being kept from you, for your visitors' own good.
How much of your data lives below the line
So how much of it disappears? I went and counted. On the median Clickport site, 89.5% of traffic-source rows, 97.4% of page rows and 93.8% of country rows sit below the 50-user line where GA4 starts hiding rows. Put plainly: on a normal site, most of your report is already under the cutoff.
That number sounds too big until you look at how a report is shaped. A handful of rows are large. Google, Direct, one or two campaigns. Everything else is a long tail of small ones, and small is exactly what thresholding removes.
I'm not the only one who's seen this. Charles Farina, one of the most-cited GA practitioners around, posted a simple before-and-after: the same top-pages report showed 207 pages with Google Signals off, and 4 pages with it on. Four. His conclusion was that most people "would likely have no idea they weren't reporting on all the data." My 97.4% for pages is his 4-out-of-207, measured across a set of sites instead of one.
Here's how I got the numbers, because a study you can't check is just a louder opinion. I took the Clickport customer sites with enough traffic to fill a normal GA4 report. For each one, over the last 28 days, I counted the visitors behind every row of three reports: traffic sources, pages and countries. Then I counted how many rows had fewer than 50 visitors, the rough line where thresholding starts. I ran it again at 25 and at 10, because Google won't confirm the real cutoff. Bot traffic is filtered out before any of this. And the visitor counts use Clickport's cookieless ID, which runs a touch higher than GA4's cross-session users, so if anything GA4 would hide even more than these numbers show. Call it a floor.
One honest note on scope. Since a change in February 2024, GA4 doesn't slap the orange triangle on every standard report by default anymore. It concentrates on reports with demographics, audiences or search terms, on anything you build in Explore, and on data pulled through the API into Looker Studio. But the moment you go looking at a breakdown, which is the whole point of analytics, you're in thresholding territory. My study measures the size of that territory: how much of your data is small enough to vanish when the rule applies. On a normal site, the answer is almost all of it.
Drag the slider below to watch it happen on a sample traffic-source report.
What triggers GA4 thresholding
Thresholding switches on when two things line up: Google Signals is collecting data, and your report touches something that could expose an individual, like age, gender, interests, an audience, or a raw search term.
Google Signals is the setting that ties signed-in Google users to your reports across their devices. That's where the demographics and cross-device numbers come from. It's also where the privacy risk comes from, because now GA4 is joining your traffic to Google's picture of real people. Turn that on, and thresholding is the tax.
There's a second trigger that has nothing to do with Signals. Google's own doc says search-query rows get withheld "if there aren't enough total users." No demographics involved. So even a site with Signals off can watch rows disappear.
And your reporting identity matters. On the Blended or Observed setting, GA4 blends signed-in data into the whole report, so plain page and source rows get thresholded too, not just the demographic ones. That's exactly what happened in Farina's 207-to-4 example. Switching to Device-based reporting identity narrows it, but Google is clear that the setting "does not affect data collection or processing." It changes how GA4 stitches your reports, not what Signals collects underneath.
If any of this sounds like a week you've already lost to a phantom bug, that's the point. There's no bug. It's working as designed. Clickport shows every row of every source, page and country by default, because it never collects the kind of data that would need hiding. More on that below, once I've been fair to Google's side.
Why Google hides the rows, and why it isn't wrong to
Google's reason is real. Small groups of people are easy to identify, and demographic data makes it easier. This isn't a made-up problem.
The classic proof is from Latanya Sweeney, now a professor at Harvard. In a famous study she showed that 87% of Americans can be uniquely identified from just three things: ZIP code, birth date and gender. None of those is a name. Together they're a fingerprint.
That's the shape of the risk. If a report row says one 25-to-34 year-old woman in a small town visited a page about a medical condition, and the row shows exactly one person, you've learned something about a real human you shouldn't know. Hiding rows with too few people is a genuine defense against that. The academic name for the idea is k-anonymity: never show a group so small that one person stands out. Google doesn't use that term for GA4, so I'll call it the closest model rather than the official mechanism.
Here's the tell, though. GA4's own Device-based reporting identity has small rows too, and it's never thresholded. So the danger was never "small numbers" on their own. It's small numbers plus a signed-in identity graph. GA4 proves that itself. Take away the identity graph, and the privacy risk that justifies the hiding goes with it.
The 50-user line Google won't confirm
Nobody outside Google knows the exact threshold, because Google has never published it. The community's best estimate is around 50 users per row, and that's a reverse-engineered guess, not a fact.
Julius Fedorovicius of Analytics Mania, who runs the most-read guide on this, puts it honestly: "I don't know the exact number, but it looks like something below 50 users/events per row." Charles Farina lands near the same place. So does Benjamin Mangold of Loves Data. Independent estimates from other practitioners cluster between 30 and 50. Nobody can do better than a range, because the source won't say.
Google will happily give you exact numbers for its other limits. Sampling kicks in at 10 million events. Its high-cardinality guidance names 500 unique values a day. Those numbers are published. The privacy threshold, the one that hides your rows, is the one number Google keeps secret.
An undisclosed, unadjustable rule is hard to plan around. You can't design a report to stay above a line you can't see. You just find out after the fact, when the triangle shows up.
Thresholding vs sampling vs (other) vs (not set)
Thresholding is one of four separate GA4 mechanisms that keep data off your screen, and people mix them up constantly. They have different triggers and different fixes, so telling them apart is the first step to knowing which one you're fighting.
| Mechanism | What triggers it | What you lose |
|---|---|---|
| Thresholding | Google Signals + demographic, audience or search-query data. Rows under ~50 users. | Whole rows, hidden behind the orange triangle |
| Sampling | An Exploration over 10 million events (up to 1 billion on 360) | Precision. Numbers become estimates, not counts. |
| (other) row | A report's row limit is exceeded, likeliest once a dimension passes 500 unique values a day (Google's high-cardinality guidance) | Detail. Rare values collapse into one "(other)" line. |
| (not set) | A value was never collected for that dimension | The data itself. It was never recorded. |
The difference that matters: sampling and the (other) row still collected your data and are showing you a compressed version of it. Thresholding and (not set) are worse, because the row is simply gone. I wrote a whole piece on (not set), the one where the value was never there. Thresholding is the other kind of gone: the data exists, GA4 has it, and it's choosing not to show you.
How to get your data back, and what each fix costs
Every "fix" for thresholding is really a trade. You give something up to make the triangle go away, and none of the trades is clean. Here's what each one actually costs.
Disable Google Signals. Free, and it does reduce thresholding. But you lose your demographics reports and your cross-device numbers, because that's the data Signals was providing. Worth knowing: since June 2026, Google Signals no longer gates Google Ads cookie and ID collection, so disabling it doesn't cut your ad remarketing the way older guides warn. That reach now rides on your Consent Mode consent rates instead. The clear cost of turning Signals off today is your demographics and cross-device reporting.
Switch to Device-based reporting identity. This one's disputed. Some practitioners say it reduces thresholding by keeping signed-in data out of your reports. But Julius Fedorovicius of Analytics Mania, testing current GA4, says flipping this setting "does not work anymore." And Google's own thresholds help page doesn't list reporting identity as a fix at all. It names exactly two: widen your date range, or export to BigQuery.
Pay for GA4 360. This is the one people assume fixes everything. It doesn't. GA4 360 raises your sampling and retention limits, but its own comparison page lists no change to thresholding. You'd spend a market-estimated $50,000 to $150,000 a year and still get the orange triangle. Thresholding is a privacy rule, not a compute limit, so money doesn't move it.
Export to BigQuery. This is the only real escape. The raw export hands you "raw event and user-level data, excluding any value additions that Google Analytics makes," and thresholding is one of those value additions applied at the reporting layer. So BigQuery genuinely bypasses it. The catch: you need a Google Cloud billing account, the free tier caps standard properties at 1 million events a day, and the schema is nested deep enough that you'll be writing SQL or hiring someone who does. Your simple pages report is now a data-engineering project.
So your choices are: lose demographics, half-fix it, pay six figures for nothing, or become a SQL shop. That's the menu for seeing your own website's numbers.
Why smaller sites lose the most
Thresholding is a fixed count, not a percentage, so it punishes small sites hardest. A row needs about 50 users to survive. If your whole site gets a few hundred visitors a month, almost every row you have is under that line.
And most sites are small. A 2019 BrightLocal study of over 11,000 local-business sites found 55% get under 500 monthly users and 13% get under 100. That data is a few years old, but the web hasn't inverted since. Ahrefs' June 2026 look at 422,421 sites found 51% sit in the lowest authority band with a median of 11 organic clicks a month. The typical website is not a traffic firehose. It's a long tail of small ones, and the privacy math was clearly built for the firehose.
In my own data, the pattern is brutal at the bottom. Sites under a few hundred monthly visitors had 100% of their traffic-source rows below 50 users. Every single row. For those owners, the demographics and breakdown reports GA4 advertises are a wall of orange triangles.
Look at the last bar. Even a site with more than half a million monthly visitors had about 93% of its traffic-source rows under 50 users, because a bigger site just has a longer tail. Thresholding isn't a small-site problem you outgrow. It's a long-tail problem, and every site has a long tail.
The rows it hides are the ones you need
Here's the part that stings. Thresholding doesn't take your big numbers. It takes your small ones, and your small ones are where all the discovery lives.
Across sources and countries, the hidden rows are about 90% of your rows but only around 5% of your traffic. So you keep your totals. Google, Direct, your top three countries, all fine. What you lose is the tail: the first visitors from a new country, the trickle from a Reddit thread that's starting to catch, the AI tool that just began sending people. The signals you'd actually act on.
Pages are worse. On the median site, the rows under the line held 48.5% of all pageviews. In other words, nearly half your actual reading happened on pages a thresholded report would hide. Your homepage is safe. The hundreds of articles doing the quiet work of your long tail are the ones that vanish.
You use analytics to find what's working before it's obvious. Thresholding hides exactly that, and only that.
Analytics that never hides a row
The clean fix isn't a setting. It's not collecting the data that creates the risk in the first place.
That's how Clickport works, and I want to be precise about why, because it's an architecture difference, not a slogan. Clickport is cookieless. It builds no cross-device identity graph, runs no Google Signals equivalent, and collects no age, gender or interest data. There's no demographic dimension to protect, so there's nothing to threshold. Your source, page and country reports show every row, always, down to the visitor who came once.
Here's the honest trade, stated flat: I can't show you a visitor's age or gender, because I never collect it. If ranking your audience by age bracket is central to your job, GA4 with Signals gives you that, and I don't. What I won't do is take your source, page and country rows hostage to protect data I chose not to gather.
That 1-visitor row is the whole argument. In GA4 with Signals on, it's a candidate for hiding. In Clickport it's a row that says 1, because one real person from a new newsletter is exactly the kind of thing you want to catch early.
None of this makes GA4 useless. Simo Ahava, who knows the platform as well as anyone, still lists "thresholding problems" among GA4's core defects, alongside its "opaque approach to privacy" and "a huge identity problem." His point isn't that GA4 is worthless. It's that these rough edges are real, and you should know about them before you build your reporting on top of them.
Frequently asked questions
What is the GA4 data threshold? It's a privacy rule in GA4 that hides report rows with too few users, so nobody can identify individual visitors from small groups. It mainly fires when Google Signals is on and a report includes demographic, audience or search-query data. Google sets the number, keeps it secret, and won't let you change it.
What is the GA4 threshold number, 50 users? Nobody outside Google knows for sure. The most common practitioner estimate is under 50 users per row, but everyone who cites it, including Julius Fedorovicius of Analytics Mania, calls it a guess. Google publishes exact numbers for sampling (10 million events) and cardinality (500 values), but never for thresholding.
Is GA4 data sampled or thresholded? What's the difference? They're separate. Sampling estimates your numbers from a subset when an Exploration crosses 10 million events, so the count is approximate. Thresholding hides whole rows for privacy when user counts are low. Sampling blurs; thresholding deletes.
How do I remove data thresholding in GA4? You can't remove it, only reduce it. Disabling Google Signals helps. Switching to Device-based reporting identity is disputed: some practitioners say it still helps, but Analytics Mania's testing says it no longer works, and Google doesn't list it as a fix. GA4 360 doesn't change it. The only complete escape is exporting raw data to BigQuery, which needs SQL and a billing account.
Does thresholding apply without Google Signals? Yes, in one case. Google's docs say search-query rows are withheld when there aren't enough total users, with no mention of Signals. For most other reports, Signals is the trigger, so turning it off removes most, but not all, thresholding.
Does thresholding affect the API and Looker Studio? Yes. The GA4 Data API applies thresholds, so any Looker Studio dashboard or connector pulling from GA4 inherits the hidden rows. Only the raw BigQuery export, which bypasses the reporting layer entirely, avoids it.
Why is GA4 hiding my report rows? Almost always thresholding. If you see an orange triangle, GA4 has decided the rows had too few users to show safely. It's not a bug or a tracking error. It's the privacy rule doing its job, at the cost of your long tail.
You paid to collect it. You should get to see it.
Thresholding is the rare GA4 limit that's honest about being on purpose. Google isn't hiding a flaw. It's hiding your data, deliberately, to protect a privacy risk that its own ad-targeting model created. The rationale is fair. The result is that most of your report, on most sites, sits behind an orange triangle you can't lift.
You collected those visits. They happened on your website. The new country, the emerging referrer, the page starting to climb, all real, all yours, all quietly filed under "thresholding applied."
I built Clickport so that never happens. No cookies, no identity graph, no demographics to protect, and so no rows to hide. Every source, every page, every country, down to the single visitor.
You can try Clickport free, no cookie banner and no hidden rows, and see every row of your own data the moment you log in, with goals, funnels, and journeys waiting underneath. And if you've already decided to leave, here's exactly how to switch from Google Analytics in an afternoon. I answer every email, so if your reports are hiding something and you can't work out what, write to me.

Comments
Loading comments...
Leave a comment