GA4 Data Sampling: Your Reports Are Estimates, Not Counts
Show article contentsHide article contents
- What GA4 data sampling is
- How wrong a sampled number gets
- When sampling hits you
- Why the long tail is where it breaks
- Even 100% isn't a count
- GA4 vs Universal Analytics: it actually samples less
- Sampling vs thresholding vs (other) vs (not set)
- How to get unsampled data, and what each costs
- Analytics that counts instead of estimating
- Frequently asked questions
- A number with a shield icon isn't a number
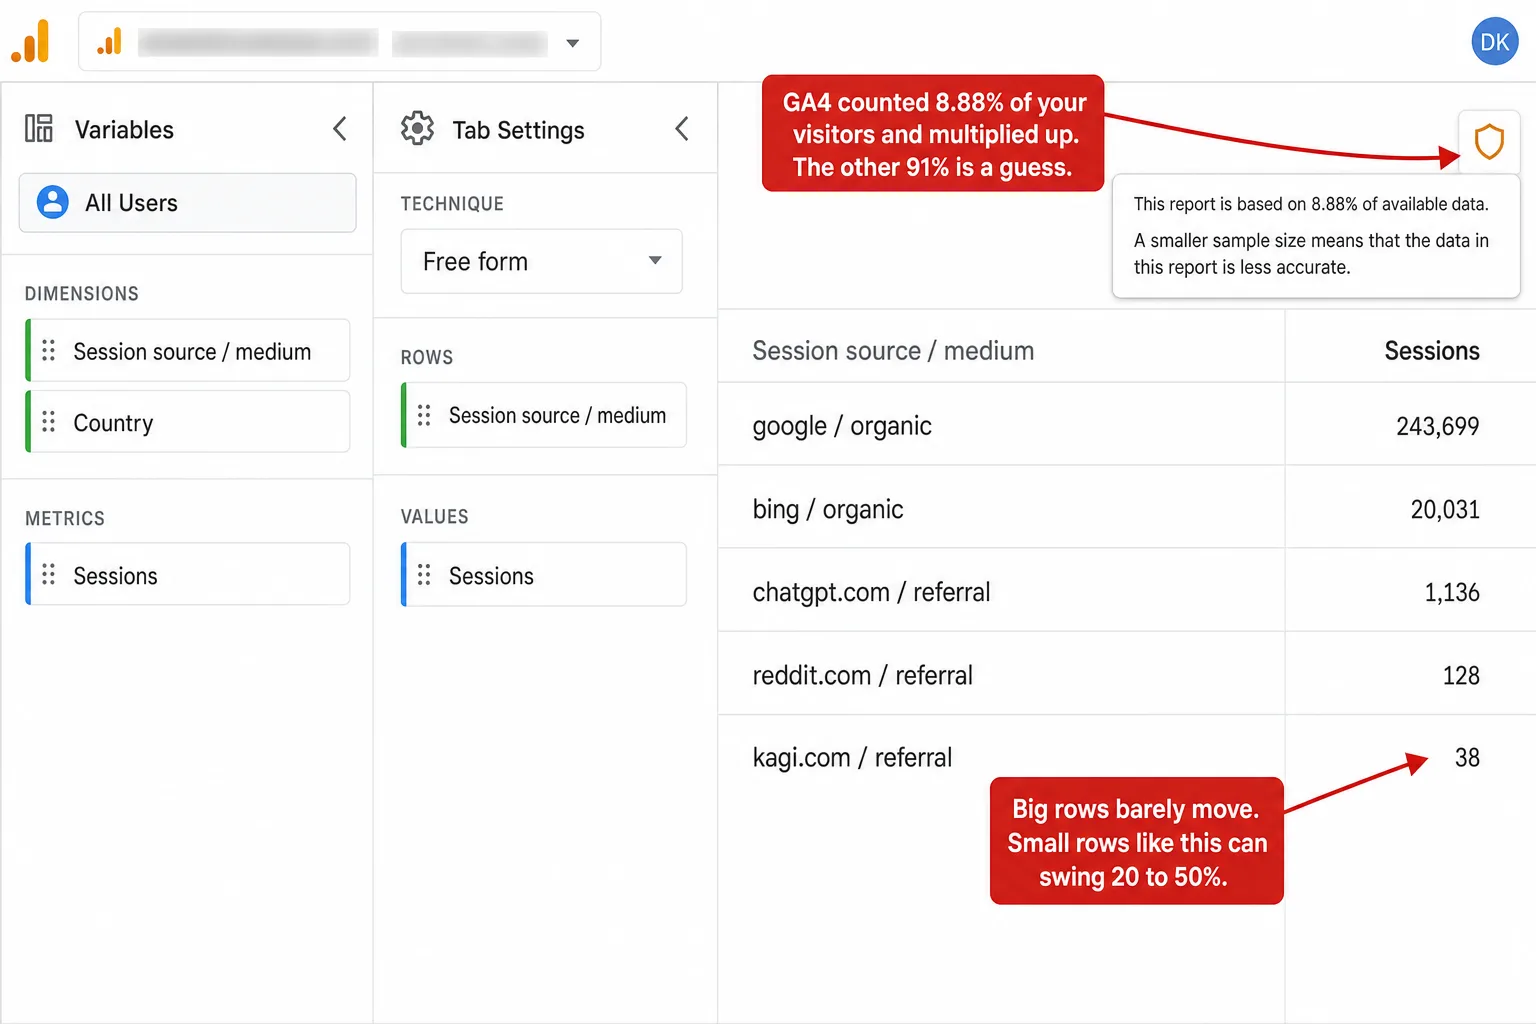
Someone on the GA4 subreddit summed it up better than Google ever has: "GA4 is built for trends, not precision." Open an Exploration on a big enough report and GA4 quietly stops counting your visitors and starts estimating them. A small icon even tells you how much: "based on 8.88% of available data." That number is the share it actually looked at. The rest is a guess, scaled up.
Sampling is one of the ways GA4 hands you a number you can't fully trust, and it's a close cousin of the row-hiding I wrote about last week. But it fails in its own way. Thresholding deletes your small rows. Sampling keeps them and makes up the numbers instead.
- GA4 data sampling means that once a query, usually an Exploration, passes about 10 million events, GA4 stops counting your visitors and estimates them from a subset, then scales up. A shield icon shows the share it used, like 'based on 8.88% of available data.'
- The error is tiny for big numbers and huge for small ones. On a real site we measure, Google's 243,699 sessions would stay within ±0.3% under sampling, while 95% of the site's 642 traffic sources are small enough to swing 20 to 50%.
- The free tier has no off switch. Your only options are to shrink the date range (which shrinks the analysis), pay for GA4 360 (roughly $50,000 to $150,000 a year), or export raw events to BigQuery and write SQL.
- GA4 samples less than Universal Analytics did: 10 million events versus UA's 500,000 sessions. So this is not GA4 getting worse. It is that any sample is a guess, and the free tier gives you no way to turn the guess off.
- Even a '100% unsampled' GA4 number is not a hard count. GA4 estimates unique users and sessions with an algorithm carrying roughly 1.6% for users and 3.3% for sessions. A cookieless tool doesn't sample at all, though counting unique visitors at scale carries that same small approximation for everyone.
What GA4 data sampling is
Data sampling is GA4 answering your question from a slice of your data instead of all of it. When a query pulls more events than GA4 wants to process, it takes a subset, does the math on that, and multiplies the result back up to full scale. The number you see is an estimate built from a sample, not a count of what happened.
Google is upfront about the trigger. Per the About data sampling help page, a standard GA4 property samples once a query exceeds 10 million events for the date range. This mostly happens in Explorations, the free-form analysis space where you build your own reports. GA4 360, the paid tier, raises the ceiling to 1 billion.
You can see when it's happening. In the top-right of an Exploration sits a small shield icon. Hover it and it says either "This report is based on 100% of available data" or something like "This report is based on 8.88% of available data. A smaller sample size means that the data in this report is less accurate." Green shield, you're fine. A percentage, and GA4 is estimating.
Read that GA4 line again. "Less accurate." It won't tell you how much less. That's the whole problem, and it's the next section.
How wrong a sampled number gets
The honest answer: it depends entirely on the size of the number. Big numbers barely move. Small numbers fall apart. Sampling error is a function of how many events sit behind a row, and that changes everything about which of your numbers you can trust.
Here's the math, and it's not GA4-specific, it's how sampling has always worked. If GA4 keeps a fraction of your data and scales up, the relative error of a scaled count is roughly the square root of (1 - sample rate) / (sampled count). A row backed by hundreds of thousands of events is rock solid. A row backed by 40 is a coin flip. To see it on real numbers, I ran GA4's sampling math over a real site's traffic.
I took one high-traffic site we measure and pulled its full traffic-source breakdown over 90 days: 642 different sources, from Google's 243,699 sessions down to a handful. Then I applied GA4's sampling. Two sample rates, matching a moderately large Exploration (33%, roughly a 30-million-event query) and a heavy one (10%, a 100-million-event query).
Look at the split. Google, off by a third of a percent. The 40-session source, off by nearly a quarter, and that's at the gentler sample rate. 95% of this site's 642 sources have fewer than 50 sessions. So under sampling, roughly nineteen of every twenty rows in the report land in that unreliable zone. The one source you'd never worry about stays perfect. Almost everything else becomes a guess.
To make it concrete: one real source on this site, kagi.com, sent 38 visits in 90 days. Run a 10% sample and GA4's estimate for it carries about ±49% at one sigma. Put another way: GA4 could report that source as anywhere from a handful to seventy-something, and call it data. Try your own numbers below.
When sampling hits you
Sampling isn't lurking in every report. It waits for the reports where you go looking for something specific: long date ranges, big traffic, and Explorations with dimensions and segments stacked on. It's the reward you get for asking a harder question.
Three things push a query toward the 10-million-event line. A long date range, because a quarter or a year piles up more events than a week. High traffic, obviously. And query complexity, because every extra dimension, segment, or filter forces GA4 down its slower, event-level processing path, which is the one that samples.
How big do you have to be? Rough math, since GA4 fires several events per visit (page_view, session_start, scroll, and more): 10 million events over 90 days is around 335,000 to 580,000 sessions a month, depending on how many events each session throws off. Stretch the window to a full year and a much smaller site crosses the line. So a mid-size site that never sees sampling in a weekly report can absolutely hit it the moment it asks "what happened this year."
One correction to the advice you'll read everywhere. People say GA4's standard reports are never sampled, only Explorations. That's almost true, and it's the safe default. But Google's own doc carves out an exception: "Filtering large datasets by country may result in data sampling in standard Google Analytics reports and Explore, even when using expanded data requests." So even the pre-built reports aren't a guaranteed safe harbour once you start filtering hard.
Charles Farina, one of the most-cited GA practitioners around, puts the trigger plainly: sampling shows up "anytime you are exceeding 10 million events and the report you created is not a pre-existing standard report." That's your cue. The moment you leave the pre-built reports to actually explore, you're on the sampling path.
Why the long tail is where it breaks
Here's the cruel part. Sampling is most accurate exactly where you need it least, and least accurate exactly where you need it most.
Your biggest sources are the ones you already understand. Google, Direct, your top campaign. They're backed by so many events that sampling barely touches them. The rows you actually study, the ones that tell you something new, are small by definition: the first visits from a channel that's starting to work, a referral from a post that's catching, an emerging AI tool sending its first trickle. Those rows are tiny, and tiny is where the error lives.
So sampling has a nasty habit. It gives you crisp, reliable numbers for the things you don't need to check, and shaky, swinging numbers for the discoveries you're trying to make. On that real site, the entire long tail of 600-plus smaller sources, the part of the report where growth shows up first, is the part sampling turns to noise.
That's the difference from thresholding in one line. Thresholding hides your long tail. Sampling shows it to you and lies about the numbers. One is an empty row. The other is a confident wrong one, which is worse, because you'll act on it.
Even 100% isn't a count
Turn off sampling entirely, get the green "100% of available data" shield, and you still don't have a hard count. GA4 estimates your unique users and sessions with a technique called HyperLogLog++, which approximates how many distinct things are in a set without storing them all.
Google publishes the precision settings GA4 uses: a finer one for users, a coarser one for sessions. Work those through the standard formula and the error lands around 1.6% for users and 3.3% for sessions, both at 95% confidence. It's small. But it means the "exact" user number on a fully unsampled GA4 report is itself a statistical estimate, not a tally. There are really two kinds of guessing going on: the big, avoidable one (sampling, which you can dodge by staying under 10 million events) and the small, permanent one (cardinality estimation, which runs on every unique count you've ever seen).
I'll be straight about my own side here, because it matters. Counting unique visitors at scale uses this same kind of approximation for everyone, Clickport included. That's a percent or two, and it's the floor nobody escapes. What a cookieless tool doesn't do is the big one. It never throws away 90% of your data and scales the rest up. More on that near the end.
GA4 vs Universal Analytics: it actually samples less
I'm not going to tell you GA4 made sampling worse, because it didn't. This is one of the few places GA4 is a genuine step up from the old Universal Analytics, and pretending otherwise would be the kind of thing this blog exists to call out in other people.
Universal Analytics sampled at 500,000 sessions per property for your date range, on the free tier. GA4 samples at 10 million events. Different units, sessions versus events, so I won't hand you a tidy "20x better" multiplier, because a session holds several events and the comparison isn't clean. But every practitioner who's measured it agrees on the direction. As Jeff Sauer's team put it, GA4 sampling is largely good news for heavy-traffic sites. You have to work harder to trip it now.
So why write about it at all? Two reasons Google didn't fix. First, the free tier still has no off switch. UA at least let you toggle "greater precision." GA4 free gives you nothing; unsampled Explorations are a 360-only feature. Second, when sampling does hit, it's still an estimate with an error nobody quantifies for you. A higher bar to trip is not the same as a number you can trust once you trip it.
Sampling vs thresholding vs (other) vs (not set)
GA4 has four separate ways of handing you a number that isn't the whole truth, and people mix them up constantly. They have different triggers and different consequences, so it's worth pulling them apart.
| Mechanism | What triggers it | What it does to your number |
|---|---|---|
| Sampling | A query (usually Explore) over 10 million events | Estimates it from a subset and scales up |
| Thresholding | Google Signals + demographic/low-user rows | Hides the whole row for privacy |
| (other) row | A report's row limit is exceeded | Collapses rare values into one line |
| (not set) | A value was never collected | Leaves it blank; the data is gone |
Sampling is the sneaky one, because it doesn't leave a hole. Thresholding gives you an empty row. (not set) gives you a blank. Sampling gives you a full, confident, normal-looking number that just happens to be wrong by an amount it won't disclose. It's the only one of the four that hides in plain sight.
How to get unsampled data, and what each costs
Every fix for sampling is a trade. You give up range, money, or a weekend to SQL. None of them is free in the way that matters.
Shrink the date range. Free, and it works: fewer events, no sampling. But you came to the report to see a quarter or a year, and now you're squinting at a week. You didn't fix the analysis. You abandoned it.
Stay in standard reports. Also free. The pre-built reports draw from pre-aggregated tables and are unsampled in almost every case. But you lose Explore, which is the entire point of doing your own analysis. And remember the country-filter exception: "almost every case" is not "always."
Pay for GA4 360. This raises the ceiling to 1 billion events and unlocks genuinely unsampled Explorations. It also costs a market-estimated $50,000 to $150,000 a year. For most businesses, paying six figures to stop your analytics guessing is not a plan, it's a punchline.
Export to BigQuery. The raw export is never sampled: it's your actual events, one row each. This is the real fix, and it's the one every frustrated analyst on that Reddit thread eventually reaches for. The cost is a Google Cloud billing account, a 1-million-event-per-day cap on the free standard export, and a schema deep enough that you're now writing SQL or paying someone who does. Your traffic report became an engineering ticket.
So your menu for seeing your own traffic without a guess is: see less of it, lose your analysis tools, pay a car's worth every year, or become a data engineer.
Analytics that counts instead of estimating
The reason sampling exists is that GA4's flexible analysis runs on an expensive, event-level processing path, and sampling is how Google keeps that path fast and cheap. The fix isn't a better sample. It's an engine that just reads all your events in the first place.
That's how Clickport works, and I want to be precise, because I just spent a whole article being annoyed at a company for being imprecise. Clickport doesn't sample. When you ask for a quarter or a year, it reads every event for that range and returns the real total. There's no shield icon, no "based on 12% of your data," no scaled-up estimate, because nothing was thrown away to answer faster.
Here's the honest edge of that claim, stated flat. Counting unique visitors at scale uses the same kind of approximation GA4's HyperLogLog does, a percent or two, and I'm not going to pretend Clickport beats physics on that. What Clickport never does is the big, avoidable guess. Your pageviews and events are exact counts. Your source, page, and country breakdowns are read from all the data, not a tenth of it. The 40-visit row that GA4 would swing by half is just 40.
None of this makes GA4 useless. For a top-line trend on a busy week, sampling never fires and the numbers are fine. But the moment you do the thing analytics is for, dig into a long range, chase a small signal, segment your way to an insight, GA4 starts estimating, right where estimates hurt most. That's worth knowing before you build a decision on a number wearing a shield icon.
Frequently asked questions
Is GA4 data sampled? Sometimes. Standard, pre-built reports are unsampled in almost every case. But Explorations get sampled once a query passes about 10 million events for the date range, and even standard reports can sample when you filter a large dataset by country. On the free tier there's no way to turn it off.
What does "this report is based on 8.88% of available data" mean? It means GA4 answered your query using only 8.88% of your events, then scaled the result up to full size. The number you're looking at is an estimate from that slice, not a count. The lower the percentage, the less accurate it is, and Google won't tell you by how much.
How accurate is sampled GA4 data? It depends entirely on the size of the number. Large totals stay within a fraction of a percent. Small segments swing wildly: a row backed by 40 visits can be off by 20 to 50%. Sampling is reliable for your biggest numbers and unreliable for the small ones you're usually investigating.
Does GA4 360 remove sampling? It raises the threshold from 10 million events to 1 billion and unlocks genuinely unsampled Explorations, so in practice it removes it for almost everyone. It also costs a market-estimated $50,000 to $150,000 a year, which is why most businesses don't use it as the fix.
How do I get unsampled GA4 data for free? Two ways. Shrink your date range so the query stays under 10 million events, which limits the analysis. Or set up the BigQuery export, which gives you raw, unsampled events but needs a Google Cloud billing account and SQL. There's no free in-product toggle.
Is GA4 sampling worse than Universal Analytics? No. UA sampled at 500,000 sessions; GA4 samples at 10 million events, a genuinely higher bar. GA4 improved here. The remaining problems are that the free tier has no off switch and that sampled numbers still carry an error GA4 never quantifies.
A number with a shield icon isn't a number
Sampling is the most polite of GA4's problems. It doesn't hide a row or leave a blank. It hands you a clean, confident figure and puts a tiny shield next to it, and if you don't hover the shield you'll never know the figure was a guess built from a tenth of your data.
The trends will be fine. Your biggest numbers will be fine. But analytics isn't for confirming what you already know about your top three sources. It's for catching the small thing before it's obvious, and the small thing is exactly what sampling can't count.
Clickport reads all of it, every time. No sample, no shield, no scaled-up guess: your pageviews and events counted in full, your long tail shown as the real numbers it is. You can try it free, and the report you build over a full year is the same shape as the data underneath it. And if you'd rather understand the wider GA4 accuracy picture first, I mapped the whole thing here. I answer every email, so if your GA4 numbers keep shifting and you can't work out why, write to me.

Comments
Loading comments...
Leave a comment