GA4 Is Too Complicated: Why You're Not the Problem
You logged into Google Analytics to answer one small question. Which of my pages got the most visits this week. Or where did this morning's traffic come from. Something you can answer in five seconds with Clickport Analytics.
Twenty minutes later you're four menus deep, staring at an empty report builder, wondering if you're just bad at this.
You're not. The basics are buried, and that is a choice GA4 made, not a failing of yours. I'm going to prove it the boring way. I'll count the clicks GA4 needs to answer four normal questions, using Google's own documented steps, and then show you the same four answers sitting on one screen.
One disclosure first. I make a privacy-first analytics tool called Clickport, so I'm not a neutral party here. That's exactly why I'm counting clicks instead of just asserting GA4 is hard. The steps are checkable, and you can redo every one of them yourself.
- It's not you. Google forced everyone onto GA4 when Universal Analytics stopped processing data on July 1, 2023, then rebuilt analytics around events and renamed the familiar pieces.
- The basics sit several menus deep. Counting your top pages this week takes six clicks through GA4's report tree, and seeing your real traffic source, not just 'Organic' or 'Direct', means switching the report's dimension. Neither is the screen you land on.
- The words keep moving. Google renamed 'conversions' to 'key events' on March 21, 2024, bounce rate was dropped then re-added with a new definition, and you juggle users vs sessions vs views.
- There is an official Google Analytics certification on Skillshop. Per published exam guides it is a 75-minute, 80-percent-to-pass, twelve-month credential. When reading your own website's numbers has a certificate that expires, the complexity is the product, not you. Put another way: nobody builds an exam for a tool that explains itself.
- A dashboard can put your top pages, real sources, and live visitors on one screen the moment you log in, with goals, funnels, journeys, and session drill-down still underneath when you want to go deep.
Why GA4 feels this way (and it isn't your fault)
You didn't choose GA4. It replaced the thing you knew. Universal Analytics, the version most people understood, stopped processing data on July 1, 2023. That means nobody opted into GA4. If you didn't migrate, your reporting went dark, so everyone was pushed onto a tool built on a different model whether they wanted it or not.
That model is the root of the feeling. GA4 is built around "events." In plain terms, almost everything a visitor does, a pageview, a scroll, a click, is an "event," and a lot of the familiar views you used to just open, you now assemble yourself.
GA4 can do an enormous amount. But here's the part the tutorials skip: it isn't built for you. GA4 is free because Google's business is advertising, and the tool exists to feed that machine with your visitors' behavior. Clear, at-a-glance answers were never the goal, so the basics got buried while the data collection runs deep. Even outlets that like GA4 concede a "steep learning curve", and one marketing writer calls it "built for analysts more than marketers." I'd go one further: it's built for Google first, and for you second.
So when you can't find a basic number fast, that is the design working as intended. Not you failing. (If you've already decided GA4 isn't for you, I made the full case for leaving separately. This piece is just about why it feels impossible.)
The four-question test
Let me make this concrete. Here are four questions a normal site owner asks all the time. For each one I counted the clicks GA4 needs today, following Google's own documented path, then checked the same answer in a dashboard. I counted menu clicks, dropdown changes, and applies. Not a worst case I invented.
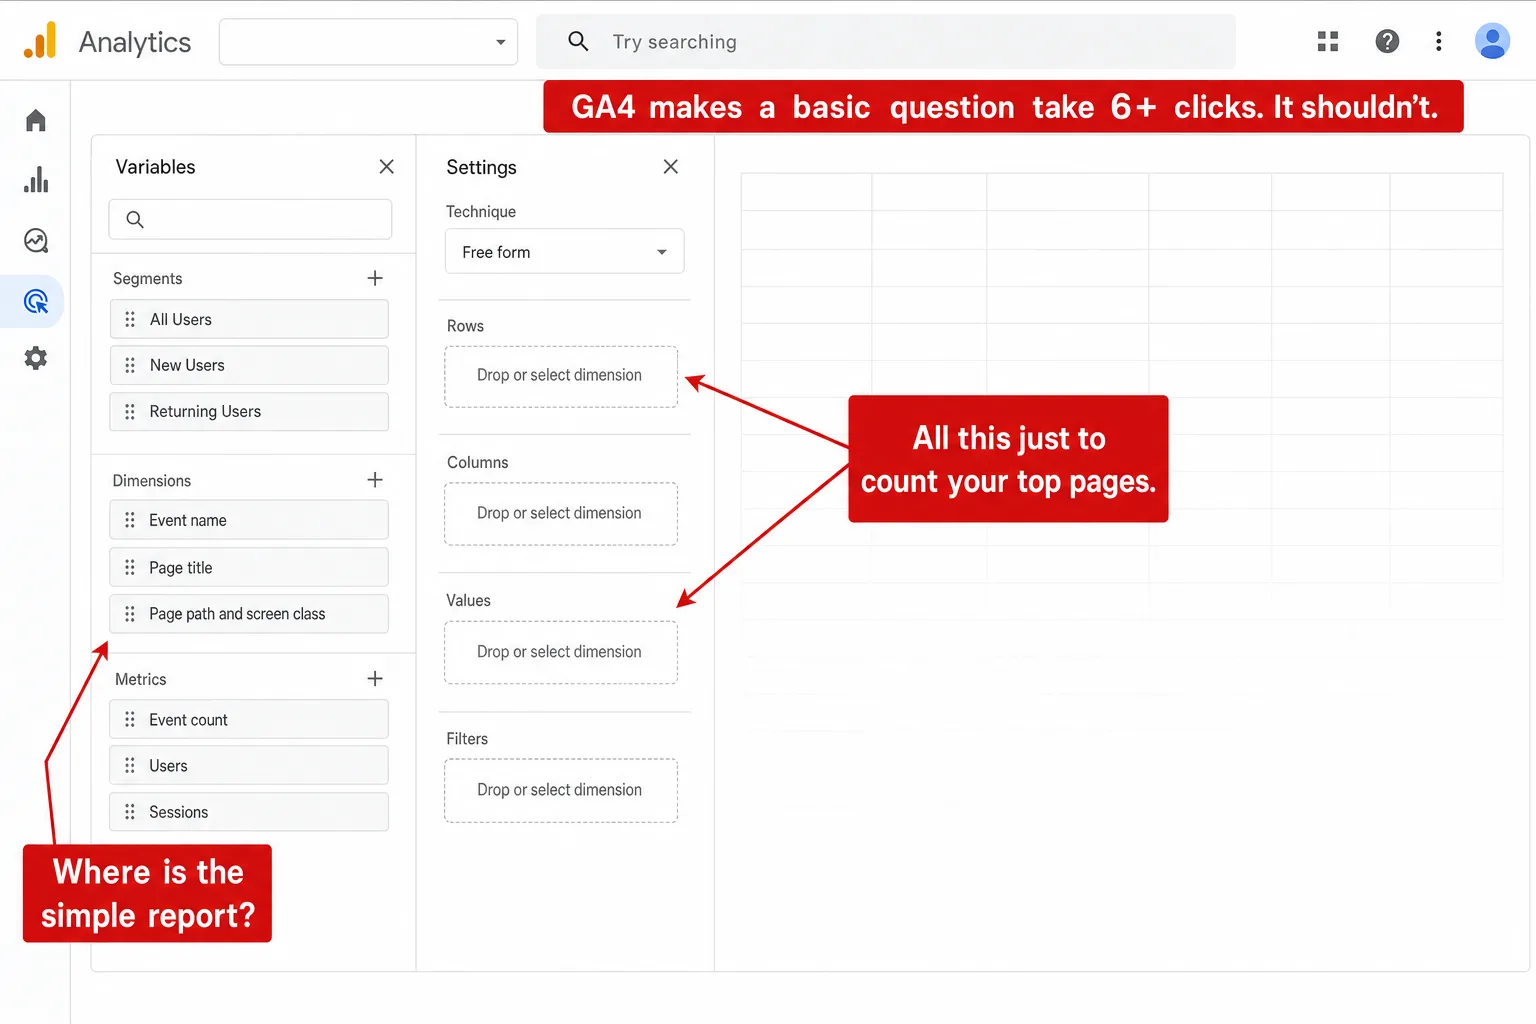
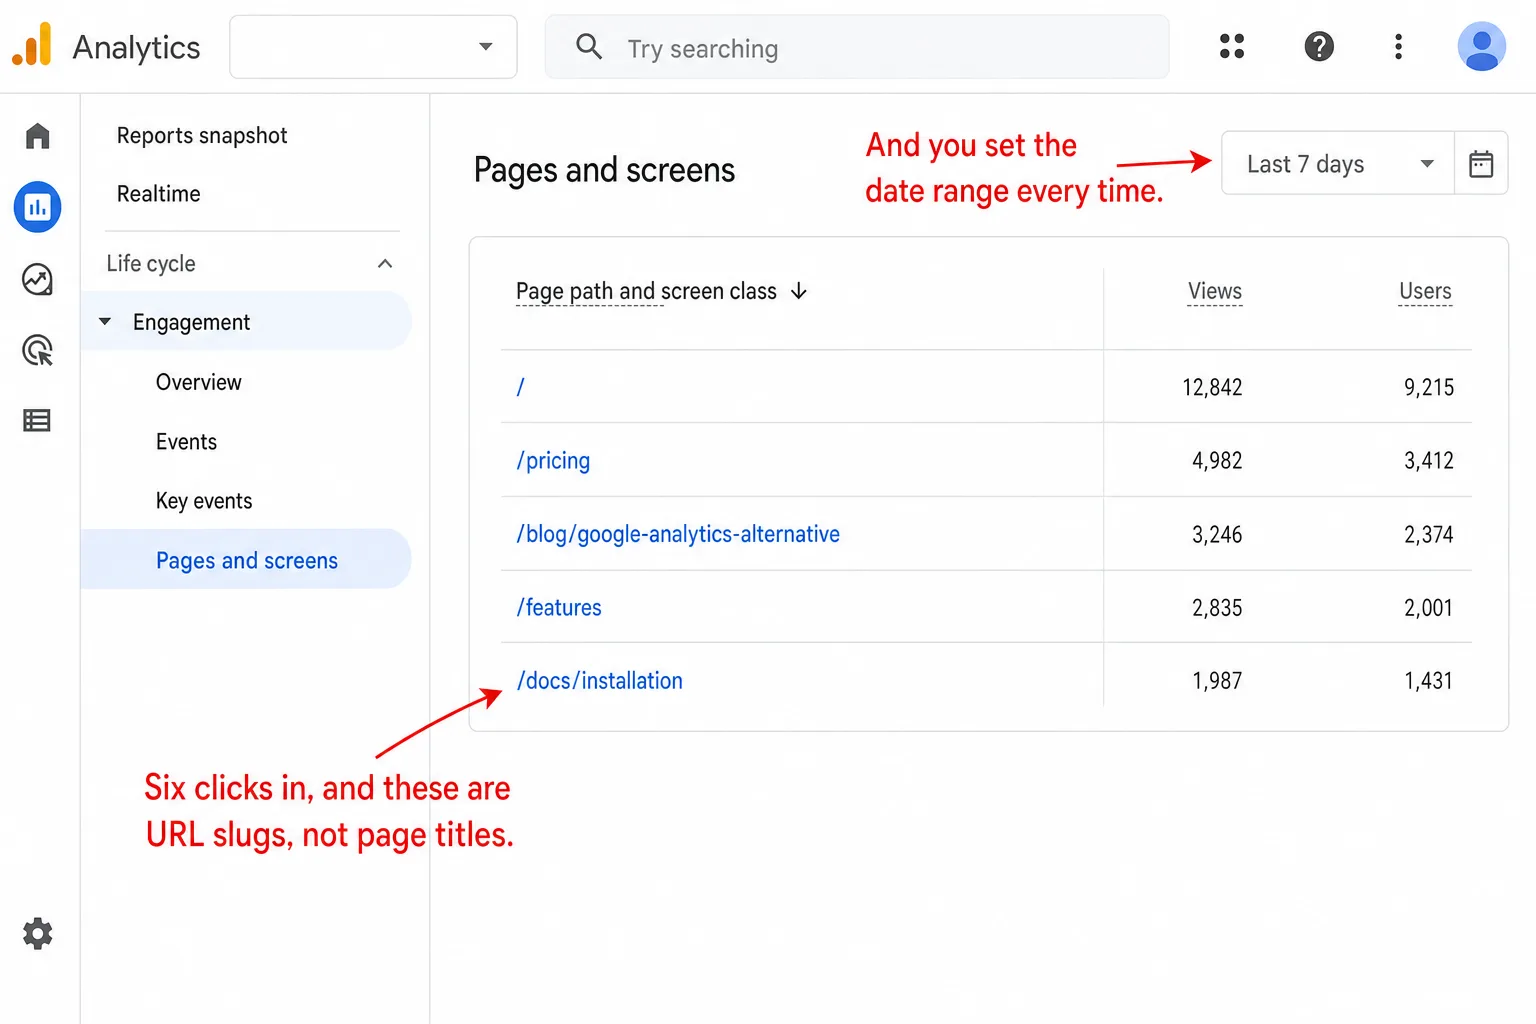
What are my top pages this week? In GA4: Reports, expand the Life cycle collection, Engagement, Pages and screens, open the date picker, set Last 7 days, Apply. Six steps, and you're four menus deep before a single number shows up. The report you land on is sortable, but the rows are URL slugs, not page titles, and it is nowhere near the screen you started on. In Clickport, your top pages this week is the panel you open to, sorted, with each page's share and engagement, and the row links straight to the live page. If you want to go deeper, you click into any page for its full story.
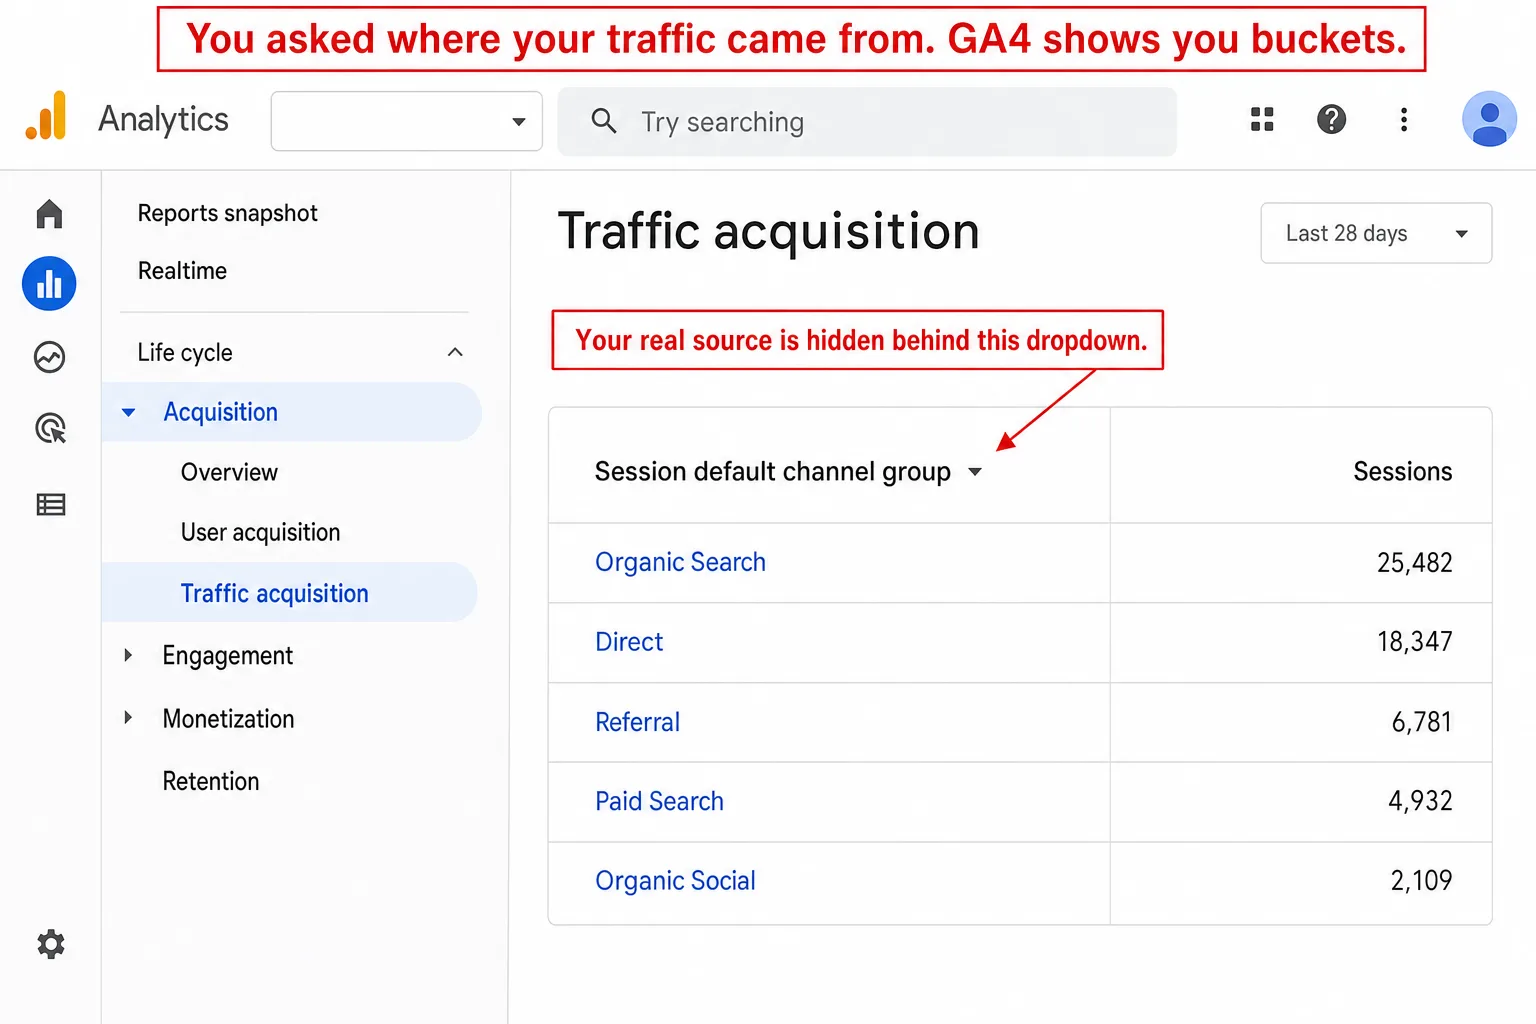
Where did my traffic come from? In GA4: Reports, Acquisition, Traffic acquisition. Five steps, but here is the catch. It opens on "Session default channel group," which means it shows you buckets, Organic, Direct, Referral, not the actual source. To learn that the traffic was Google, or a newsletter, or ChatGPT, you open the dimension dropdown and switch to "Session source / medium." GA4 makes the one thing you asked for, the actual source, the hidden second step. In Clickport, the real sources are on the landing screen, with Channels, Sources, and URLs as sub-tabs, including AI sources like ChatGPT and Perplexity that GA4 files away under Direct or Referral.
Who's on my site right now? In GA4: Reports, Realtime. Two clicks, the fewest of the four, and the closest GA4 gets to easy. Even here the catch is real: it's a 30-minute rolling window, not a true "right now," and it's still a screen you navigate to, not the one you land on. In Clickport, the live count sits on the dashboard you open to and refreshes on its own.
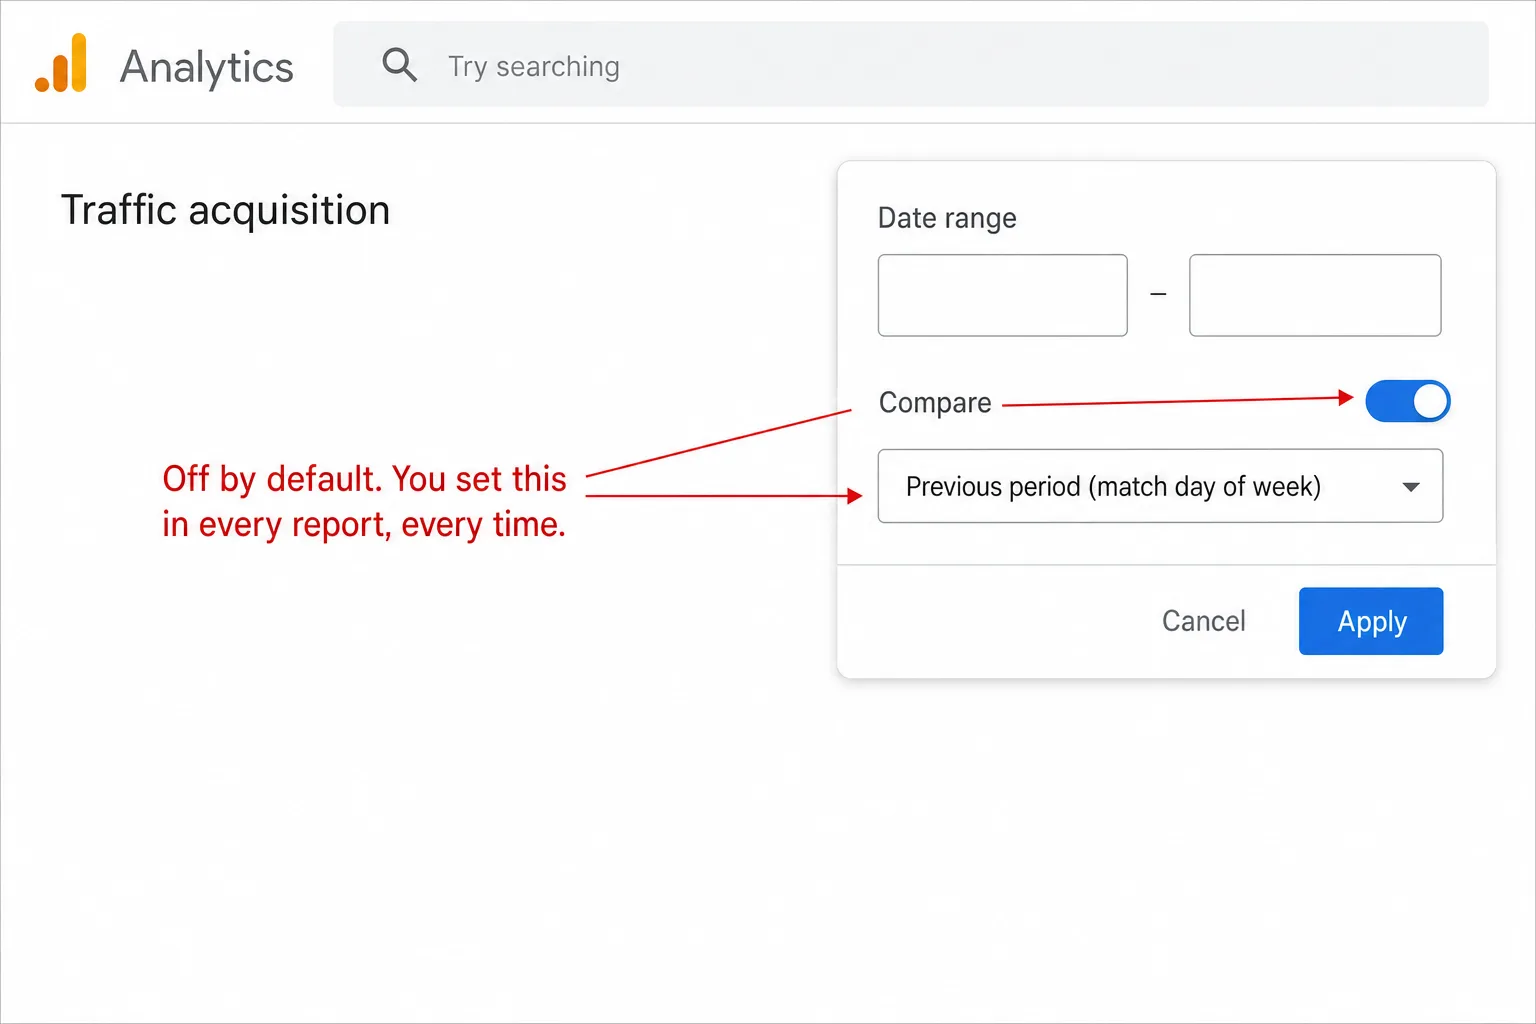
How did this week compare to last? In GA4: open a report, open the date picker, click Compare, choose a comparison method, Apply. Six steps, comparison is off by default, and you set it again in every report you open. In Clickport, the up-or-down delta against a weekday-aware baseline is on every metric by default, no toggle, which is the strip you'll see at the end of this piece.
So of four everyday questions, three took five to seven clicks, and the easiest still took me off the screen I started on. None of that is analysis. It's just getting to the number.
Try Clickport free
30 days free. No credit card required.
The words keep changing under you
The complexity isn't only navigation. It's that the vocabulary keeps moving under you.
"Conversions" became "key events." On March 21, 2024, GA4's in-app notice told users, word for word, that "Analytics conversions have been renamed key events," and a "conversion" now means an action for your Google Ads campaigns, not just your business. You can call it a rename or a redefinition; either way the word you learned points somewhere else now. Google framed it as "unifying how conversions are defined" to make things "simpler and more intuitive."
Bounce rate, the metric everyone understood, was dropped when GA4 launched, then quietly re-added with a different definition, the inverse of engagement rate. Same word, new meaning. And day to day you juggle users, sessions, and views, three separate counts for what feels like one question: how many people came.
There's a certification exam for reading your own numbers
Here's the detail that gives the whole thing away. There is an official Google Analytics certification on Skillshop, Google's own training platform. Per published exam guides it's a 75-minute timed exam, 80 percent to pass, valid for twelve months. In plain English: reading your own website's traffic is now a credential that expires.
Sit with that. Reading your own website's numbers has a credential, and the credential expires. Tools you understand don't come with an exam. (The complexity is big enough to have built a whole training economy on top of it, which I get into on the cost side.)
It's not just you: the whole internet is saying it
If you still half-suspect you're the problem, look at what ranks when you search the complaint. The top results for "GA4 too complicated," "why is GA4 so confusing," and "GA4 hard to use" aren't answers. They're threads, full of people asking the same quiet question.
That "am I too dumb" in the first thread is the exact feeling I want to take away from you. It's wrong. Even the calm experts agree it's the tool: GA4 is "built for analysts more than marketers," and ironically that's why the marketers who just need an answer can't get one. The whole genre is people asking each other the same quiet question, over and over, about something that was never their fault.
GA4 still won't answer the basics. A dashboard can.
So here's where it leaves you. Of four questions you ask every week, GA4 needed five to seven clicks on three of them, and pulled you off your landing screen on all four. In plain English: the numbers exist, but getting to them is the job.
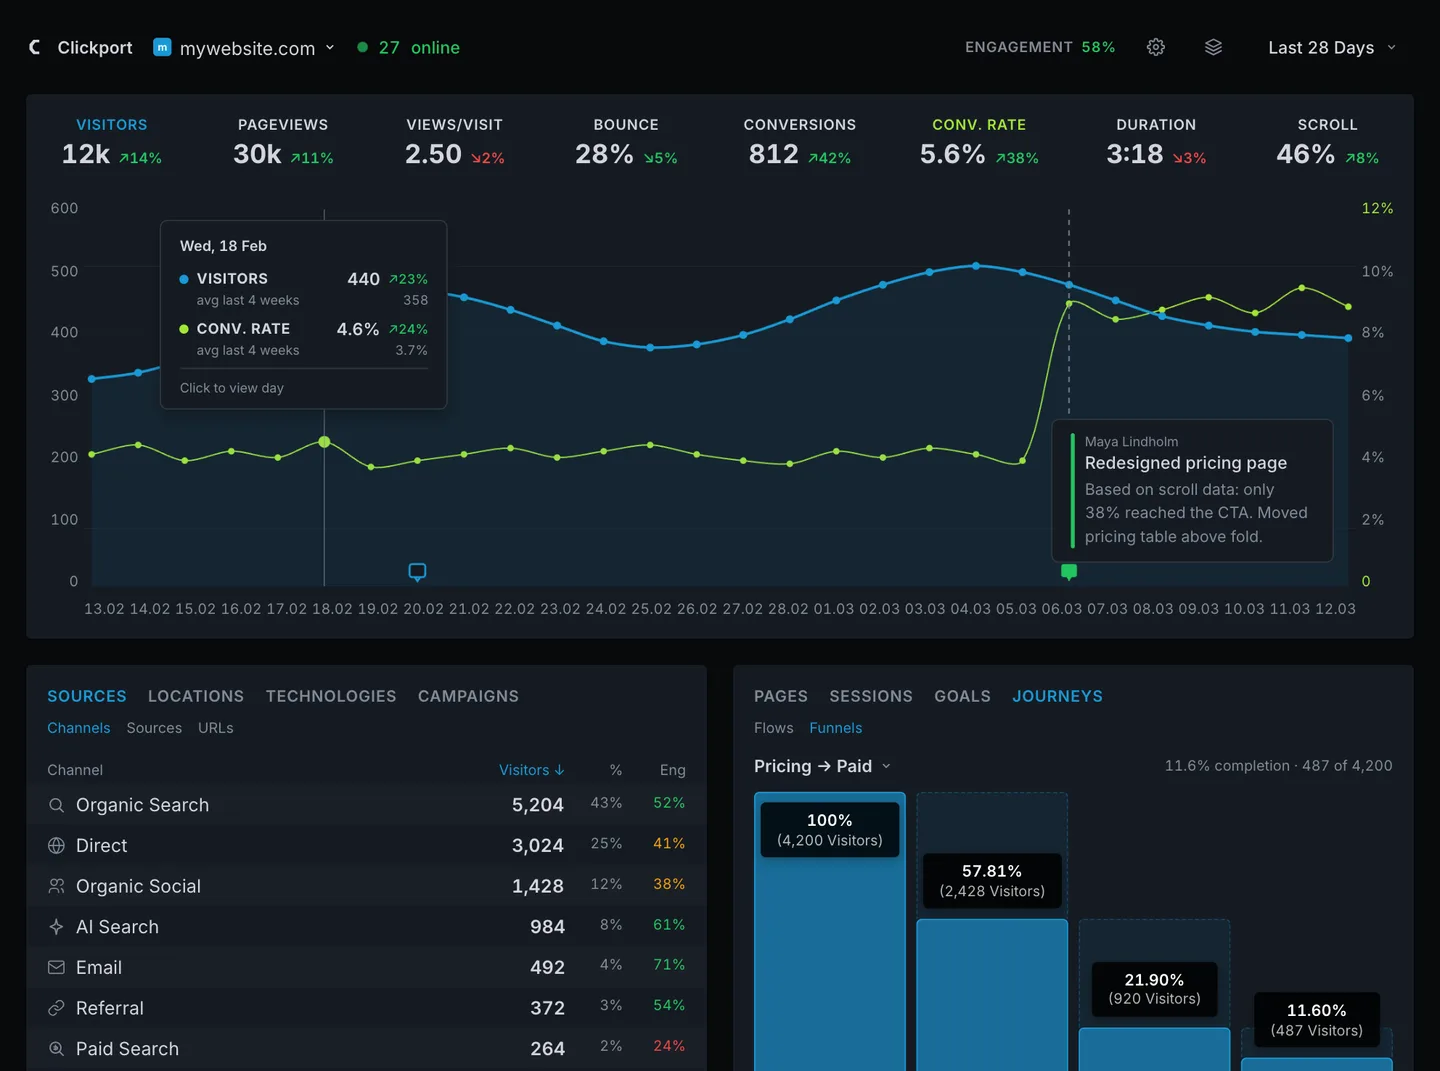
Let me be clear about the alternative, because this is not a story about a stripped-down tool. In Clickport, your top pages, your real sources, and your live visitors are the screen you land on, and goals, funnels, journeys, session-level drill-down, segments, and cross-filtering are all still there, one click underneath, the moment you want to go deep. Clear on the surface. Deep when you need it. That's the part GA4 gets backwards: it leads with the depth and buries the basics.
GA4 also quietly undercounts the traffic it does show you, but that's a separate problem. I took it apart in is GA4 accurate, and the GA4 Data Loss Estimator puts a percentage on it for your own site. This piece is only about the everyday struggle to find a number at all.
You shouldn't need a certificate to read your own website. The basics should be the first thing you see, not the last thing you build.
If you opened GA4 for one number and gave up, you already know the feeling this whole piece is about. With Clickport, your top pages, your real traffic sources, and your live visitors are on the screen the moment you log in, with goals, funnels, and journeys waiting for whenever you want to go deeper. No report to build. No dimensions to drag. No certification required. And if you've already decided to leave, here's exactly how to switch from Google Analytics in an afternoon. I answer every email, so if you get stuck, write to me.
Try Clickport free
30 days free. No credit card required.

Comments
Loading comments...
Leave a comment