GA4 Not Showing Data? Every Fix (and Why It Keeps Happening)
Show article contentsHide article contents
GA4 not showing data? It's one of two things. Either a small mistake you can fix in 30 seconds, like a typo in your measurement ID. Or a deeper design choice that loses your data for good, with no recovery option. The quick fixes come first. The permanent ones come after.
- GA4 takes 24-48 hours to process standard reports. Seeing visitors in real-time but zero in reports is normal, not a bug.
- Over half of EU visitors reject cookies when given a fair choice. GA4 loses that data permanently. Google's behavioral modeling requires 1,000+ daily users with consent and 1,000+ daily denied events. Most sites never qualify.
- Ad blockers hide 15-40% of all visitors from GA4. For tech audiences, up to 58%. GA4 provides no warning, no estimate, and no indication these visitors exist.
- GA4 hides data through four separate mechanisms: thresholding (rows under ~50 users disappear), sampling (above 10M events), cardinality limits (500+ values become '(other)'), and 2-month default data retention.
- These are architectural decisions, not bugs. No amount of configuration fixes the processing delay, the consent data loss, or the ad blocker blindness. They are built into how GA4 works.
Check if your tag is actually firing
You are staring at an empty dashboard, wondering if your site is broken, your tracking is dead, or the last hour you spent configuring something failed without a word. Take a breath. It is almost certainly one of four things, and you can check all four in a few minutes.
Step 1: View your page source. On your website, press Ctrl+U (Windows) or Cmd+Option+U (Mac). Search for G- to find your measurement ID. Is it there? If not, your tracking code is missing entirely. Add it through Google Tag Manager, a code snippets plugin like WPCode, or straight into your theme's <head> tag.
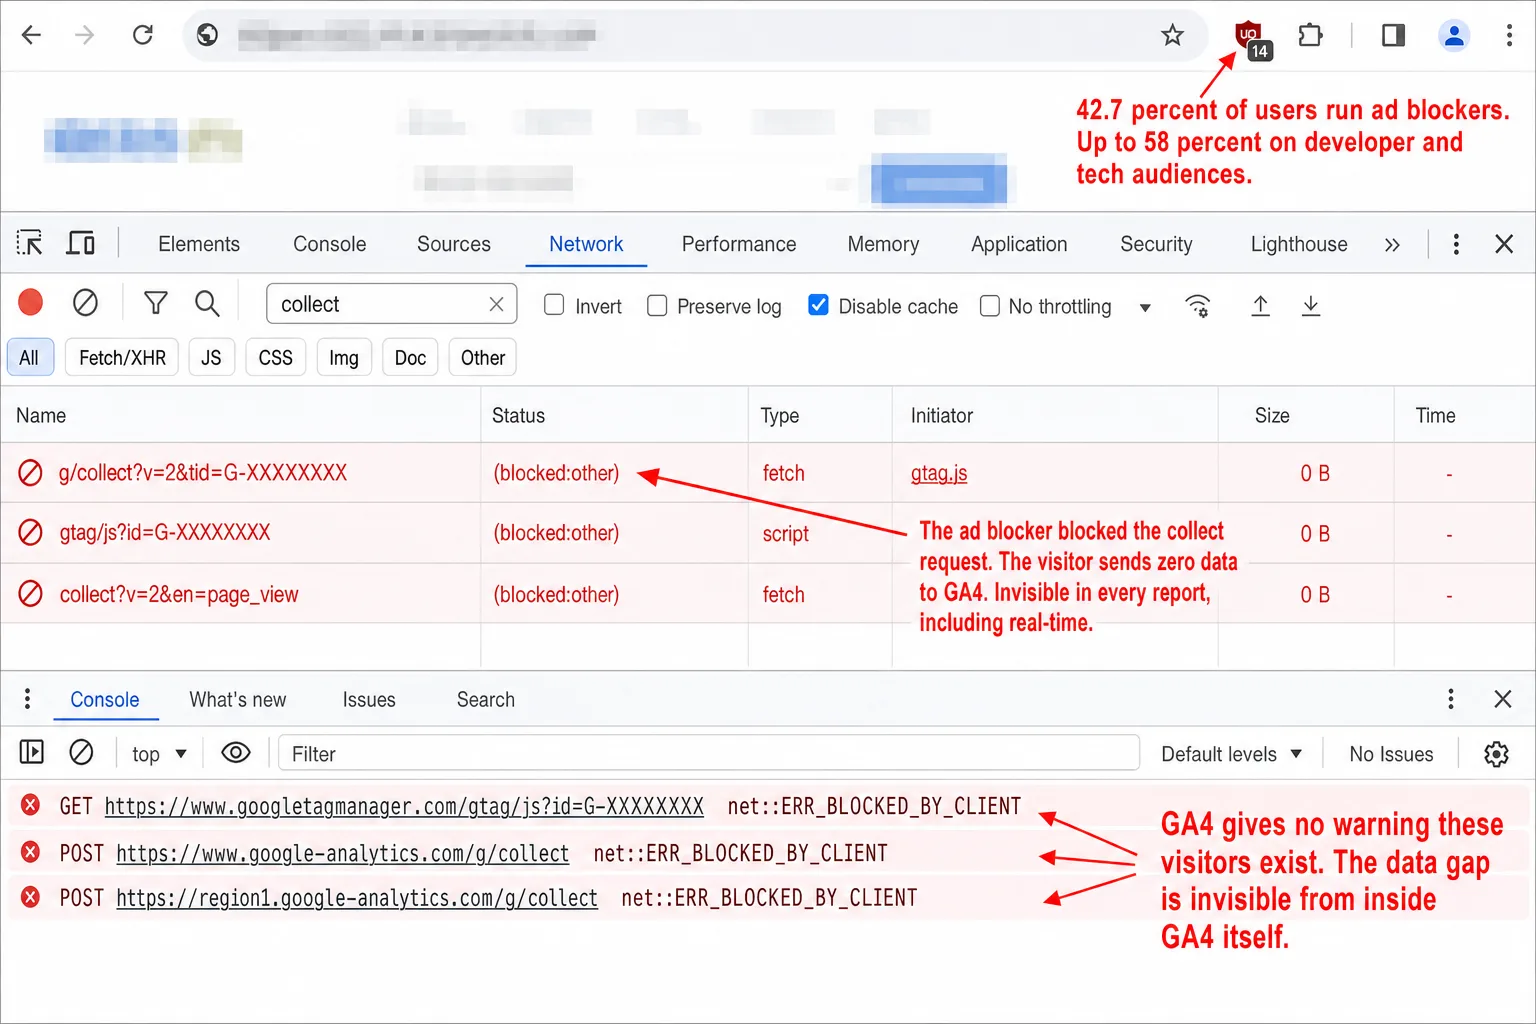
Step 2: Check the network requests. Open Chrome DevTools (F12), go to the Network tab, and filter for collect. Reload the page. You want to see requests to google-analytics.com/g/collect come back with status 200 or 204. No requests at all means the script is blocked or broken. Requests that fail point to ad blockers, Content Security Policy headers, or firewall rules.
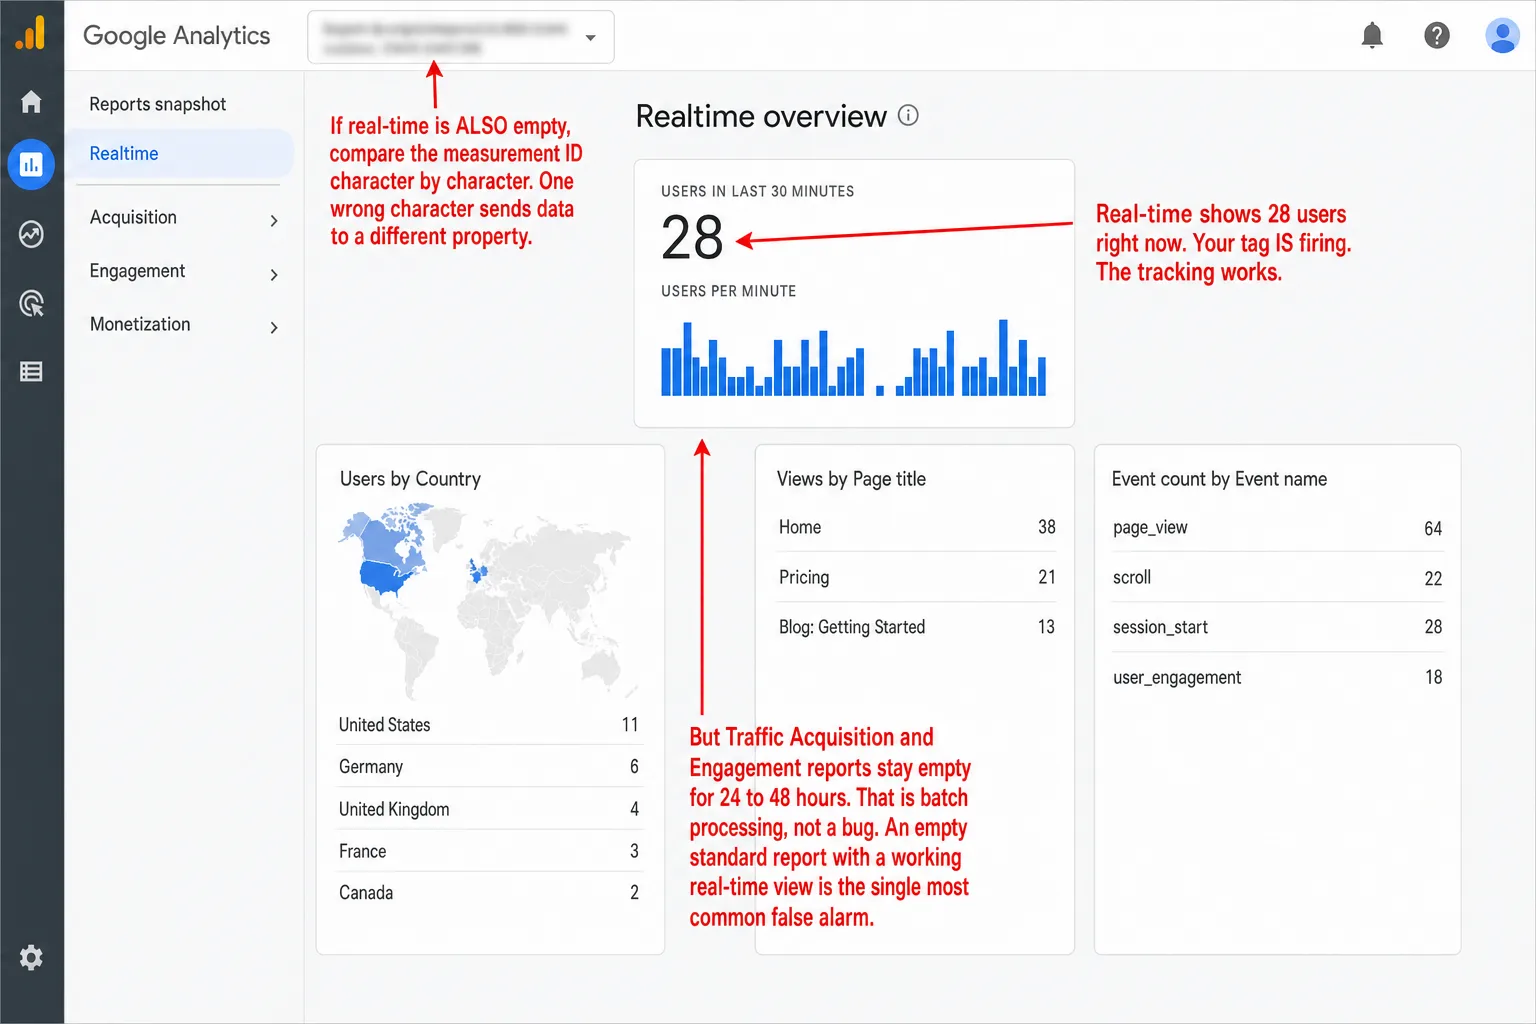
Step 3: Check GA4 real-time. In GA4, go to Reports > Real-time. Open your website in an incognito window, no extensions, and click through a few pages. Within 60 seconds you should see yourself show up. If you do, your tag works. The standard reports being empty after that is a processing delay, not a tracking failure. More on that in the next section.
Step 4: Verify the measurement ID. Go to Admin > Data Streams, click your web stream, and copy the measurement ID. Now compare it character by character with what sits in your page source or GTM tag. One wrong character and your data goes to a different property entirely. It's one of the most common causes, and one of the easiest to miss.
A few more usual suspects. GTM changes saved but never published, so click Submit > Publish. An internal traffic filter set to "Active" with an IP range so broad it swallows your real visitors (Admin > Data Filters, switch it to Testing). Enhanced Measurement switched off (Admin > Data Streams, toggle it on). WordPress caching plugins minifying or deferring the GA script, so exclude gtag.js and googletagmanager.com from JavaScript optimization in WP Rocket, LiteSpeed Cache, or Autoptimize. Work through that list and you've cleared the easy half. The hard half comes next. No setting fixes it.
The 24-48 hour wait is real
GA4 runs two completely separate pipelines. Real-time reports show you raw events within seconds. The standard reports you live in day to day, Traffic Acquisition, Engagement, Pages, run through a batch pipeline that takes 24 to 48 hours to finish.
So when you see yourself in real-time but nothing in Acquisition, nothing is broken. This is not a bug, it's the design. Google batches the data to run attribution modeling, bot filtering, session stitching, and the behavioral modeling that powers consent mode. The visit you can see in real-time right now won't reach your Acquisition report until tomorrow or the day after.
It gets slipperier. Conversion attribution can keep shifting for up to 12 days after the event, as Google retroactively re-adjusts its data-driven model. Late events from mobile apps or offline imports are accepted for 72 hours. Anything later than 72 hours is dropped and never appears at all.
On free GA4 there is no way to make the standard reports go faster. GA4 360, which starts north of $50,000 a year, pulls intraday processing under an hour.
Your consent banner is hiding your visitors
Do you have EU traffic and a cookie consent banner? Then this is likely the real reason your numbers look thin.
GA4 sets cookies (_ga, _ga_<container-id>) on every visitor. Under GDPR, a cookie like that needs explicit opt-in consent before it can be placed. So when a visitor denies consent, or just ignores the banner, GA4 in Basic Consent Mode collects nothing from them. Not less data. Zero data.
Read that number plainly. When the Accept and Reject buttons carry equal weight, 50 to 60% of EU visitors say no. More than half of your European traffic, gone before GA4 sees a single pageview. In Germany and France, fewer than half consent to tracking cookies at all. Advanced Consent Mode tries to patch the hole with cookieless pings that feed Google's modeling. But the modeling only kicks in once you have at least 1,000 daily users who granted consent and 1,000 daily events from visitors who denied it, each held steady for 7 days running. Most small and medium sites never come close.
The most common WordPress version of this is worse still. The consent plugin shows a banner, but it never passes a consent signal to the Google tags. The banner looks compliant. The wiring behind it doesn't exist. GA4 reads no consent state, so it blocks all EEA and UK collection by default. After Google's July 2025 enforcement, sites with this exact misconfiguration lost most of their European traffic overnight. And that data is gone for good. Fix the plugin tomorrow and you still can't get back what was never recorded.
Ad blockers are hiding the rest
Roughly 42.7% of internet users run an ad blocker. That's close to half the web carrying a tool that treats GA4 as something to stop. uBlock Origin, Brave, and Ghostery all block it by default. The script either never loads or its requests get cut off before they leave the browser. Either way, that visitor is invisible in every GA4 report you have, real-time included.
How much you lose depends on who reads you:
For a developer or tech audience, that 50 to 60% means GA4 is missing more than half of the people on your site, and it never tells you. No warning, no estimate, no row that hints these visitors were ever here. The gap is invisible from inside GA4 itself. If your audience skews technical and the numbers feel too low to be true, this is almost certainly why. (For tools that don't get blocked at the network level, see our comparison of GA alternatives.)
Want a real number for your own site instead of a range? Run it through the GA4 Data Loss Estimator. It splits the loss across ad blockers, consent rejection, Safari ITP, and GA4's own internal limits, with a cited source behind each one.
GA4 is hiding data on purpose
Even when GA4 is set up perfectly and firing on every visit, four separate mechanisms quietly shrink what you're allowed to see.
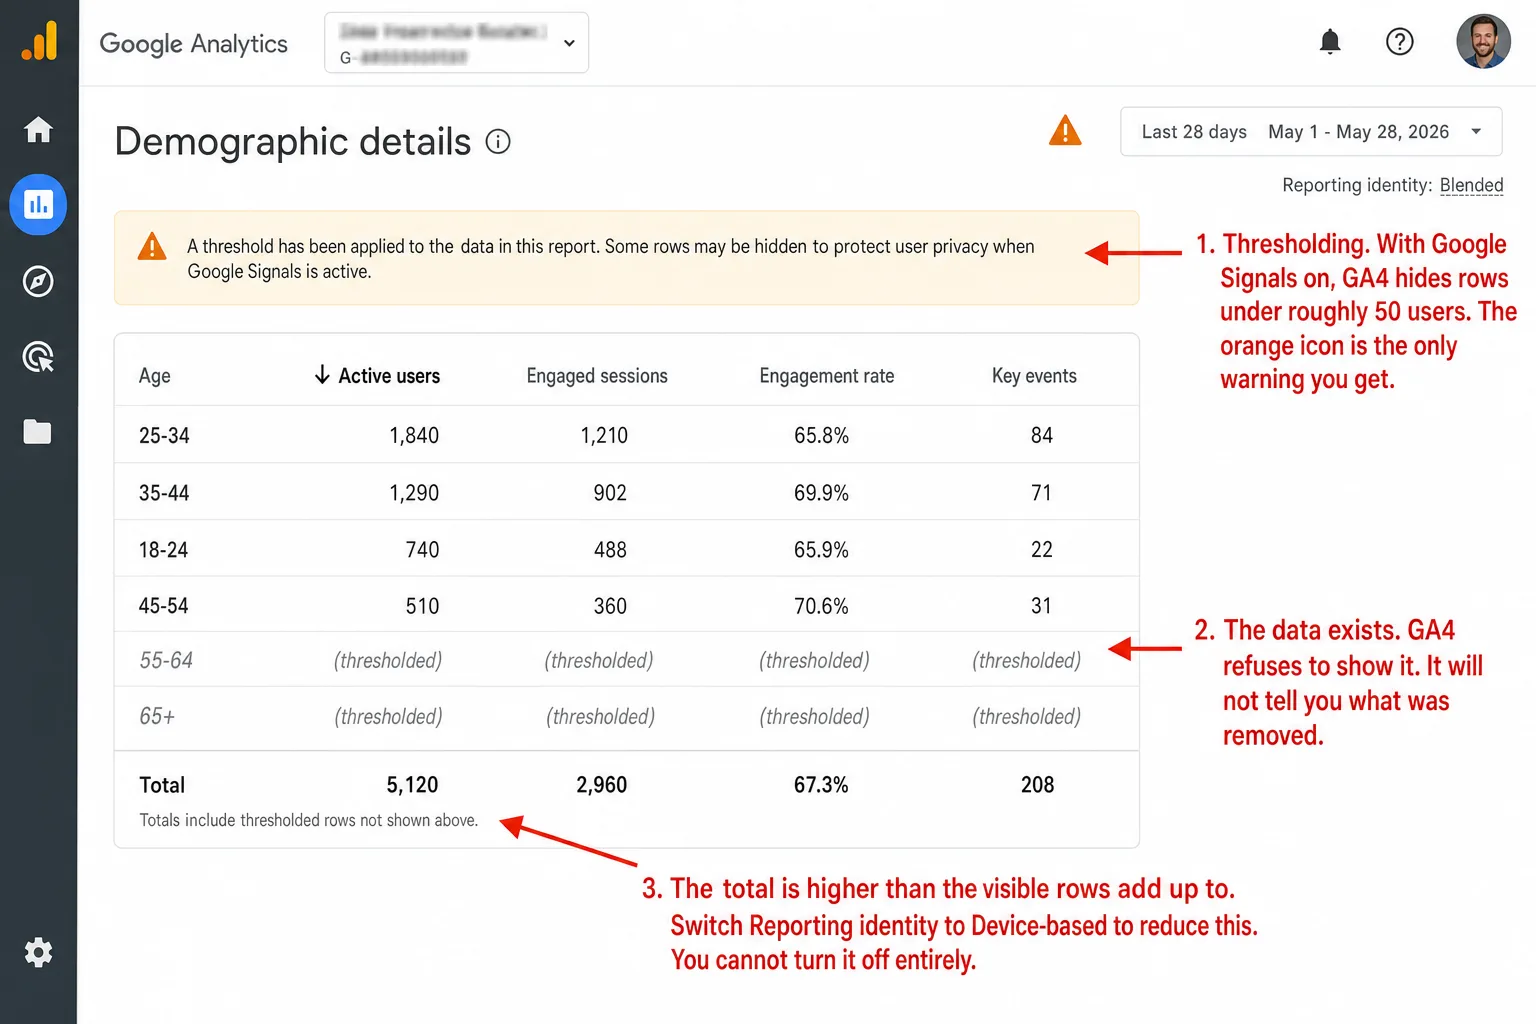
Thresholding. Turn on Google Signals for cross-device tracking, and GA4 starts hiding any report row where the user count falls below roughly 35 to 50 people. The data is sitting right there. GA4 just refuses to show it. An orange icon appears, and when you click it, GA4 tells you in its own words: "thresholding applied." That's the whole message. No count, no list of what got removed, nothing you can act on. You can soften it by switching to device-based reporting identity (Admin > Reporting Identity), but you cannot switch thresholding off.
Sampling. Once an Exploration query covers more than 10 million events, GA4 stops counting all of them. It takes a sample, extrapolates, and shows you an estimate behind a yellow shield icon with the sample rate. At low rates the error margin can hit 38%, which means your numbers could be off by more than a third. Standard reports dodge this by reading pre-aggregated tables. The catch is that a standard report and an Exploration can then show two different numbers for the same dates.
Cardinality limits. Any dimension with more than 500 unique values in a day gets flagged as "high-cardinality." When a report runs out of rows, the lowest-traffic values get swept into a single "(other)" bucket. So if your site has thousands of distinct page URLs, you see the top performers and the long tail vanishes into "(other)." There's no way to crack that bucket open.
Data retention. By default GA4 keeps event-level data for just 2 months. Almost nobody changes the setting. Two months on, your Exploration reports go blank for that older window. The standard aggregated reports survive, but any custom analysis on older data comes back empty. The most you can ask for on free GA4 is 14 months (Admin > Data Retention), and it isn't retroactive, so set it before you need it.
The fixes that actually work
Some of this you can genuinely fix. For tag problems, the diagnostic above is the whole checklist: fix the measurement ID, publish your GTM container, check your CSP headers, and pull analytics scripts out of your caching plugin's optimization.
For internal traffic filters, open Admin > Data Filters. If a filter is set to "Active," make sure its IP rules aren't catching your real visitors. Flip it to "Testing" for 48 hours and watch what comes back.
For thresholding, switch reporting identity to "Device-based." For sampling, tighten your date range or drop a secondary dimension. For data retention, change it to 14 months today, knowing it won't reach back to data you already lost.
Then there's the part you can't fix. Consent-mode loss and ad-blocker loss have no setting behind them. These aren't configuration mistakes you made. They're the direct result of how cookie-based, client-side JavaScript analytics works. The script has to load in the visitor's browser, set its cookies, and ship the data to Google's servers. Break any link in that chain and the data was never recorded.
Analytics that show data the moment you install them
Step back and every problem in this article comes from one design. A client-side snippet that ships your data to a third-party server, processes it in batches, leans on cookies, waits on consent, and sits in the crosshairs of every major ad blocker. Fix one symptom and the design hands you the next.
Clickport is built the other way around. One script tag in your HTML. The data goes straight into a ClickHouse database with no batch queue, no processing delay, and nobody standing in the middle. The Realtime view refreshes every 30 seconds.
Script sets cookies
Consent check (blocks 50%+ in EU)
Ad blocker check (blocks 15-40%)
Data sent to Google servers
24-48 hour batch processing
Thresholding hides small rows
Sampling estimates large reports
Data available (maybe)
Script runs (no cookies)
No consent needed
First-party script (not ad-blocked)
Data inserted directly to ClickHouse
Available in next 30-second refresh
No thresholding, ever
No sampling, ever
Data available (always)
No cookies means no consent banner. No consent banner means no EU data loss. No Google dependency means no "(not set)," no "(other)," no 14-month retention limit. Every number you see is real, observed data. It never samples. It never hides a row from you.
And it's not thin in exchange. Clickport tracks scroll depth, clicks, form submissions, file downloads, outbound links, 404 errors, internal search terms, and copy detection on its own. You also get session-level drill-down, goal tracking with revenue, cross-filtering, annotations, PDF reports, CSV exports, and 16-channel traffic classification including AI Search.
I think that's a better trade for a lot of sites. You just spent 10 minutes reading about why GA4 won't show you your own data. Clickport would have shown it in the time it took to read this sentence.
Start your free 30-day trial. No credit card. One script tag. Two minutes.

Comments
Loading comments...
Leave a comment