Attribution Modeling Explained: Every Model, The Math, and What Actually Works in 2026
In my experience, attribution modeling is the most important decision in marketing analytics. The default in every tool is wrong. GA4's "data-driven" model is a black box that quietly degrades to last-click, and the consent banner hides most of your data before any model gets to touch it. So I think the model debate misses the point. You can pick the perfect model and still build it on a third of your traffic.
Quick disclosure before we start: I run Clickport, a cookieless analytics tool, so when I argue that seeing all your traffic beats a fancy model on part of it, that's me talking my own book. The model math and the studies below hold up regardless.
- 6 attribution models exist, but GA4 only offers 2. Most small businesses are better served by last-touch on every visitor than data-driven on the 30% who accept cookies.
- GA4 removed 4 of its 6 attribution models in 2023, leaving only data-driven (a black box that silently falls back to last-click) and last-click.
- Cookie consent banners hide 60-70% of EU visitors from GA4. Cookieless analytics needs no consent banner, so it counts the visitors GA4 loses at the banner.
- UTM parameters are the last reliable attribution signal. Safari 26 strips 3 major ad click IDs (gclid, fbclid, msclkid) but preserves UTMs.
- 70.6% of AI search traffic lands as 'Direct' in GA4 because there's no default AI Search channel. That traffic is growing 130-150% year-over-year.
What is attribution modeling (and why most marketers get it wrong)
Attribution modeling is the set of rules that decides which marketing touchpoint gets credit for a conversion. A conversion is whatever you care about: a purchase, a signup, a form submission, a demo booking.
The concept's simple. The execution is where it falls apart.
Nobody meets your brand once and buys. I've never seen it happen. B2C buyers usually need 6-20 touchpoints before they convert. B2B SaaS deals average 266 touchpoints and 2,879 impressions per closed deal, and that touchpoint count has climbed about 20% since 2023. In plain English: hundreds of moments, all fighting for credit on one sale. Think about what 266 means. It's 266 separate moments all fighting for the credit on a single sale. And 70-80% of B2B prospect interactions are anonymous. That's the "dark funnel," the research a buyer does long before they ever contact you.
So someone finally converts. Which touchpoint earned it? The blog post that introduced them? The email that kept them warm for weeks? The Google search that brought them back the day they were ready to buy?
Every model answers that question differently. And the answer you pick is the answer your budget's going to follow.
This isn't a thought experiment. Companies without solid attribution pour money into the wrong places every day. When your blog shows 10% credit under time-decay, you cut the content budget. When the same blog shows 100% under first-touch, you double down on it. Same data.
Opposite decision. The only thing that changed was the model.
Every attribution model explained (with the actual math)
Most guides define each model in one sentence and move on. I'll show you the math behind each one, because the math is where the decision really gets made.
First-touch attribution
100% of credit goes to the first touchpoint that introduced the customer to your brand.
Credit = 100% to touchpoint #1, 0% to everything else
When it's useful: It tells you which channels bring people in the door. If you're trying to grow your audience, first-touch shows you what's working at the top of the funnel. It's especially handy for B2B companies with long sales cycles, where you want to know what started the conversation.
When it's misleading: It ignores everything that's happened between the first hello and the sale. An email sequence that nurtured the lead for six months gets nothing. Zero.
Last-touch attribution
100% of credit goes to the final touchpoint before conversion.
Credit = 100% to the last touchpoint, 0% to everything else
When it's useful: It's good for tuning bottom-of-funnel campaigns. Retargeting, branded PPC, and direct-response ads all look great under last-touch, because they're built to close. Two thirds of B2B marketing teams still lean on it. 67% rely on last-touch. In plain English: two thirds of teams still credit only the final click, and for a simple sales cycle that's perfectly fine.
When it's misleading: It quietly starves every channel that builds awareness. The podcast sponsorship that planted the seed six months ago? Nothing. The blog post that taught the buyer everything they know? Nothing.
Linear attribution
Equal credit distributed across every touchpoint in the journey.
Credit per touchpoint = 100% / N (where N = total touchpoints)
Four touchpoints? Each gets 25%. Ten touchpoints? Each gets 10%. That's the whole model.
When it's useful: When you honestly don't know which touchpoints matter more and you want a fair, balanced view. It's a sensible starting point for a company that's new to attribution.
When it's misleading: It hands a throwaway social impression the same credit as the demo call that closed the deal. Touchpoints aren't equal, and linear pretends they are.
Time-decay attribution
The closer a touchpoint sits to the conversion, the more credit it gets. And it ramps up fast.
The standard formula uses a half-life. Google defaulted to 7 days:
Credit weight = 2^(-t / halflife)
Where t = days between the touchpoint and conversion.
Worked example with a 7-day half-life and a conversion on day 14:
- Google search on day 14 (t=0):
2^(0/7) = 1.00→ 42% - Social ad on day 12 (t=2):
2^(-2/7) = 0.82→ 29% (after normalizing, rounded) - Email on day 5 (t=9):
2^(-9/7) = 0.41→ 19% - Blog post on day 1 (t=13):
2^(-13/7) = 0.27→ 10%
All raw scores are normalized to sum to 100%.
When it's useful: Short sales cycles, where the most recent interactions really are the ones that mattered. E-commerce during a sale. Promotions with a hard deadline.
When it's misleading: It punishes brand building. If your B2B sales cycle runs six months, the awareness touchpoints that started the whole relationship get next to nothing.
Position-based (U-shaped) attribution
40% to the first touchpoint, 40% to the last touchpoint, and the remaining 20% split equally among everything in between.
With 5 touchpoints: 40% / 6.67% / 6.67% / 6.67% / 40%
A variant called W-shaped adds a third anchor point (typically lead creation): 30% / 30% / 30% for the three key moments, with the remaining 10% split among middle touchpoints.
When it's useful: B2B marketing where both the awareness (first touch) and the close (last touch) carry weight. It respects the whole journey without pretending every middle touch counts the same.
When it's misleading: The 40/20/40 split is made up. No data says the first and last touch deserve exactly 40% each, or that they're worth the same. I've looked for it. Someone picked those numbers because they're tidy.
Data-driven attribution (DDA)
Here the machine learning looks at your real conversion paths and hands out credit based on what each touchpoint genuinely contributed. There are two main ways to do the math:
Shapley Values (used by Google): work out each channel's average marginal contribution across every possible ordering of channels. The idea comes from Nobel laureate Lloyd Shapley, who published it in 1951. It needs a lot of data to be reliable, on the order of 10,000+ converting journeys.
Markov Chains: treat the journey as a set of states with probabilities of moving between them. The trick's the "removal effect": take a channel out of every path, then measure how much your overall conversion probability drops. Those drops get normalized to 100%.
When it's useful: When you have enough conversion data to feed it. This is the most accurate model on paper, because it learns from your real journeys instead of a rule someone invented.
When it's misleading: It needs a lot of conversions before it works. And, as the next section shows, Google's version of it has a transparency problem that's hard to forgive.
Google removed 4 attribution models. Here's why that matters.
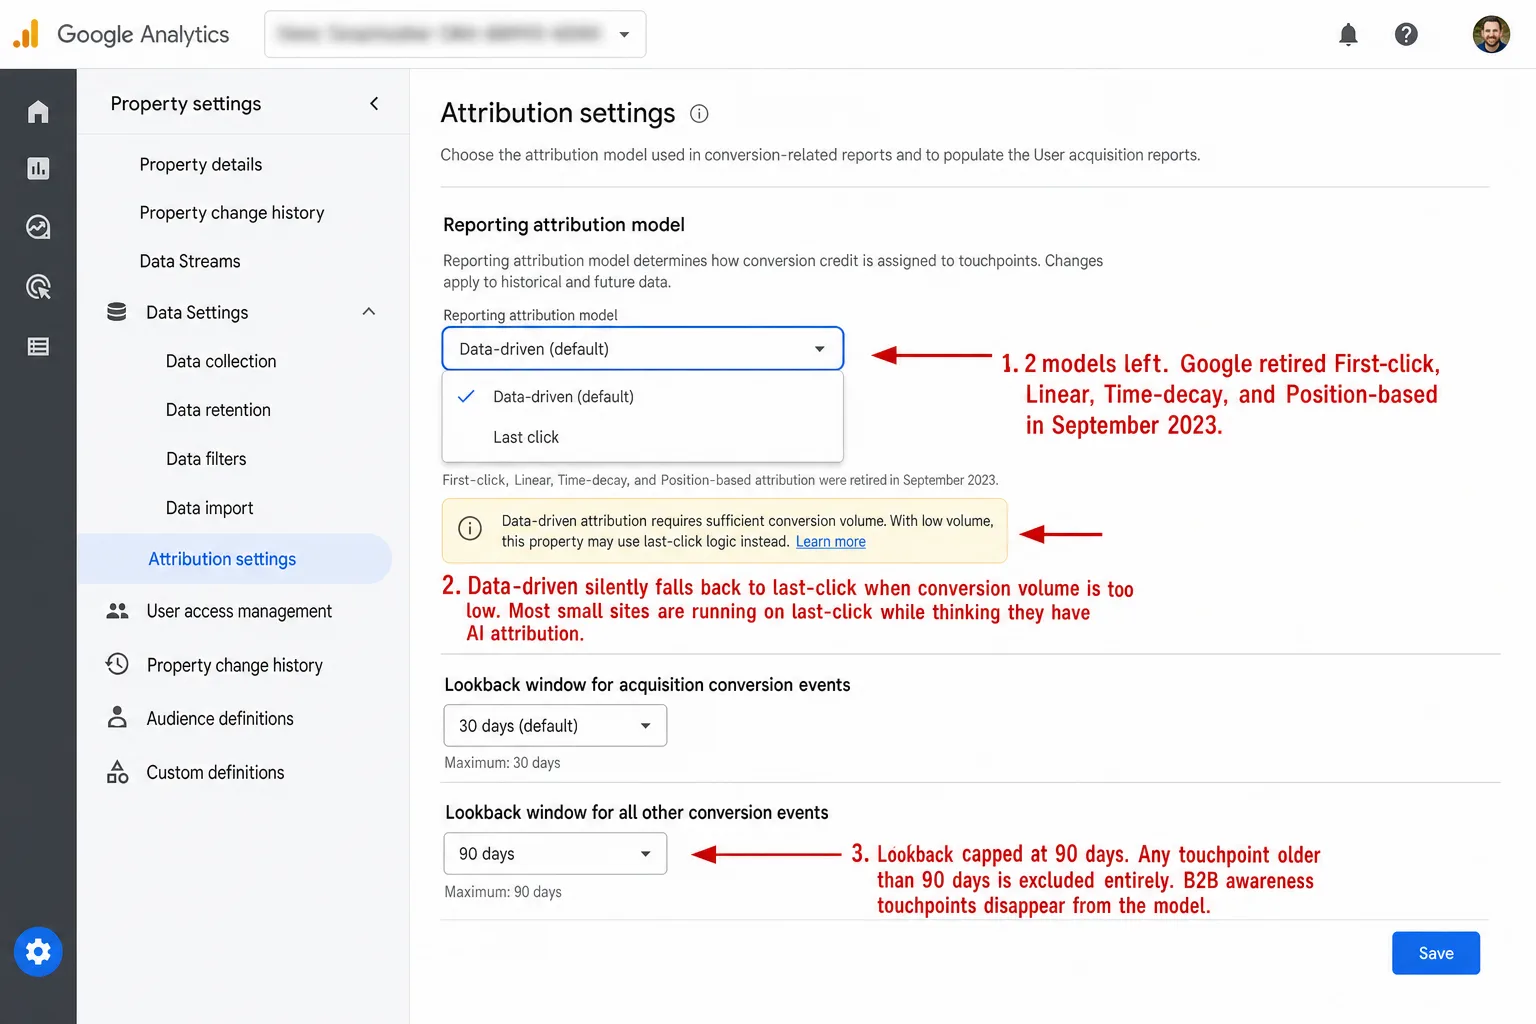
In late 2023, Google fully sunset first-click, linear, time-decay, and position-based attribution in both GA4 and Google Ads. If you were still using one of them, you got switched to data-driven attribution whether you liked it or not.
Google's reason: these rule-based models "don't provide the flexibility needed to adapt to evolving consumer journeys."
I think the real reason is plainer than that, and I'll say it. Fewer than 3% of conversion actions in Google Ads used these models. That means Google dropped the options almost nobody touched. Almost everyone was already on data-driven or last-click. So Google dropped the options hardly anyone touched.
But "hardly anyone" still includes the marketers who picked those models on purpose, because they were transparent and predictable. A linear model always splits credit evenly. A time-decay model always runs the same formula. You can check the math yourself. You'll explain it to your CEO without flinching.
Data-driven attribution? You can't check it, because it's a black box. And a black box is a problem.
It got more confusing from there. In March 2024, GA4 renamed "conversions" to "key events". The mechanism underneath is exactly the same. But now GA4 says "key events" while Google Ads still says "conversions," and the two numbers don't line up, because Google Ads layers its own conversion modeling on top. So you have one company, two products, two words for the same thing, and two answers.
Why GA4's data-driven attribution is a black box
GA4's data-driven attribution (DDA) uses machine learning to read your conversion paths and hand out credit. On paper it should be the most accurate model you can get. In practice it has four problems, and each one is worse than the last.
Problem 1: It silently falls back to last-click. Google officially dropped the minimum data requirements for DDA. But practitioners report that without enough conversion volume, GA4 quietly reverts to last-click logic anyway. The settings page still says "data-driven." It just isn't doing it. So most small and mid-size businesses are running plain last-click while believing they have clever AI attribution.
Problem 2: You can't audit the algorithm. DDA is a proprietary black box. You'll see the output. Channel X got 30%, channel Y got 70%. You can't see the inputs, the weights, or the logic. There's no way to check why one channel beat another. You either trust the box or you don't.
Problem 3: Google is grading its own homework. Google owns the DDA algorithm and it owns Google Ads, the platform that collects the credit. That's a structural conflict of interest, and the numbers fit the suspicion. Research finds that 68% of multi-touch attribution models over-credit digital paid channels. That means more than two thirds tilt toward paid. And switching from last-click to DDA tends to cut email's credit while pushing Google Ads credit up.
Problem 4: The lookback window stops at 90 days. GA4's longest attribution lookback window is 90 days. The default is 30 days for acquisition events and 90 for other key events. Anything older than 90 days is dropped from the model completely. If your B2B sales cycle runs 6-12 months, the awareness touchpoints that started the relationship don't exist as far as GA4's concerned. They happened. The model just never sees them.
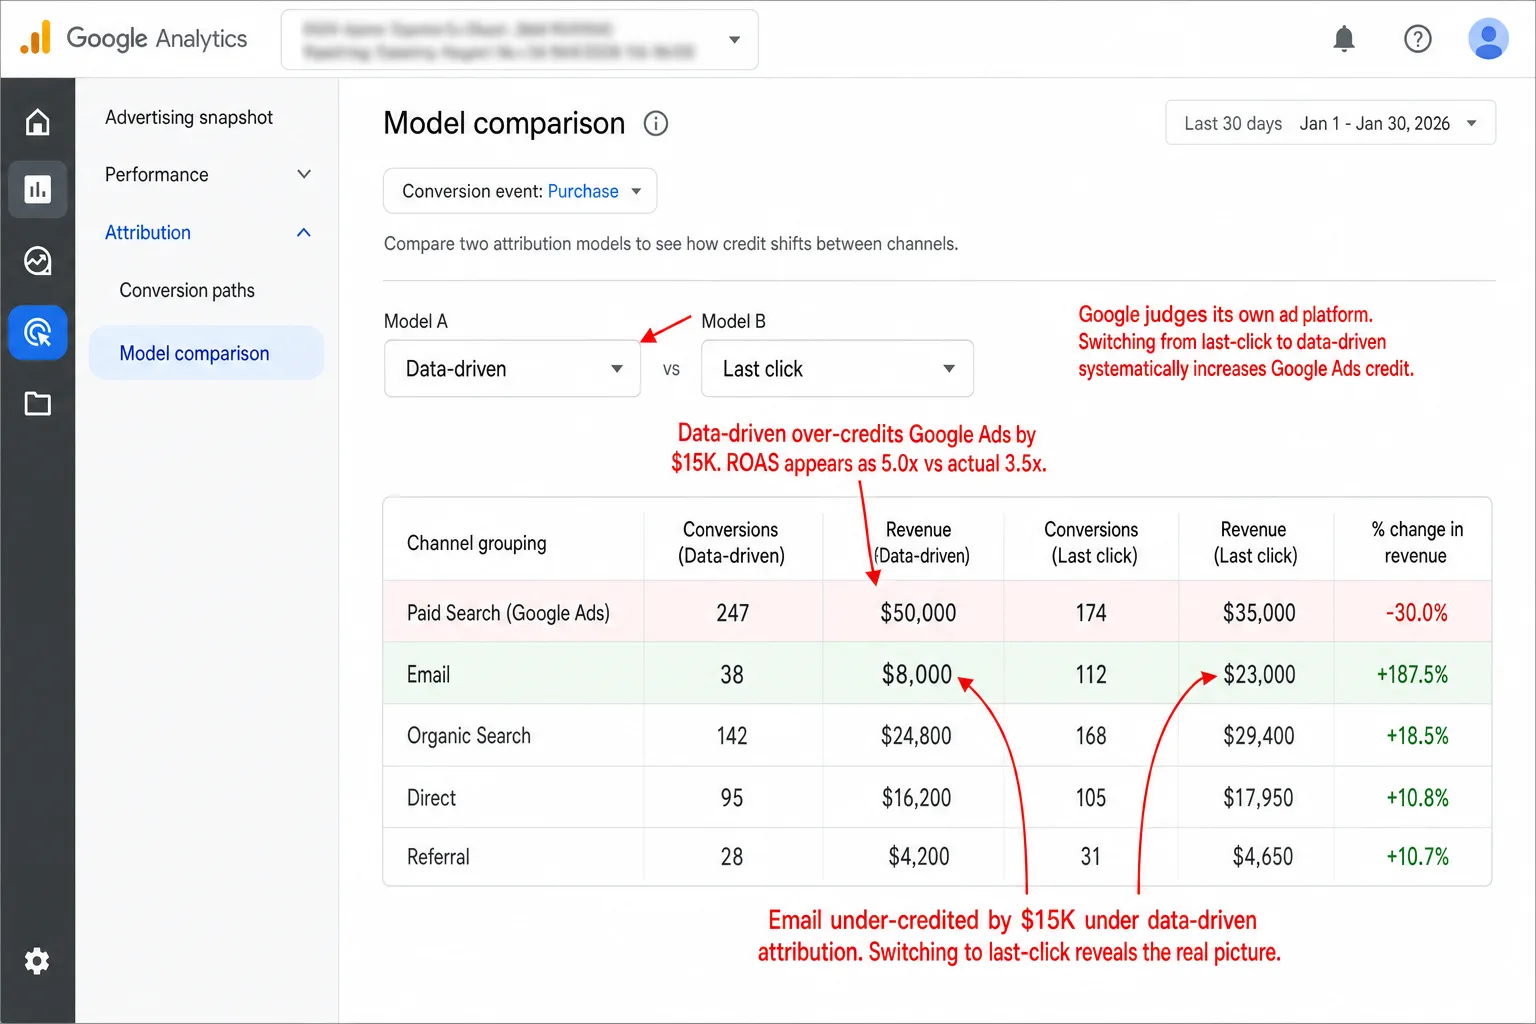
Recast wrote up a case where a quick switch to Google's DDA model burned $40,000 in wasted ad spend that had to be refunded to the client. That means forty grand spent on the strength of a number the box couldn't explain. DDA had been crediting Google Ads campaigns that weren't driving any extra conversions at all. Forty thousand dollars, spent on the strength of a number the box couldn't explain.
So here's where I land, after chewing on it for a while. Data-driven attribution is the best model in theory, and I want to be fair to it. But the algorithm is opaque, it's run by an ad platform that profits when paid wins, and it slides back to last-click without a word. Put those three together and "data-driven" stops being a method. It becomes a marketing word.
The consent gap: why cookie-based attribution misses 60% of your visitors
This is the attribution problem that swallows all the others. If your analytics tool runs on cookies, and the law makes you ask for consent first, most of your visitors are invisible to you.
The numbers are blunt. In GDPR-compliant Europe, 60-70% of visitors reject cookies once you give them a real "Reject all" button. That means roughly two in three say no. So roughly two out of every three people say no. The etracker Consent Benchmark 2025 put the average data loss from compliant banners at 60%.
The clearest example I've seen comes from the privacy regulator itself, and it still amazes me. The UK's Information Commissioner's Office lost 90.8% of its tracked visitors after putting up a compliant consent banner. Their daily tracked users fell from 119,417 to 10,967. In plain English: the body that writes the cookie rules nearly vanished from its own analytics. That tells you everything.
When 60-90% of your visitors are invisible, every attribution model breaks. First-touch, last-touch, linear, data-driven, it makes no difference. You're modeling a fraction of your real traffic and calling it the picture. I've watched teams do exactly that.
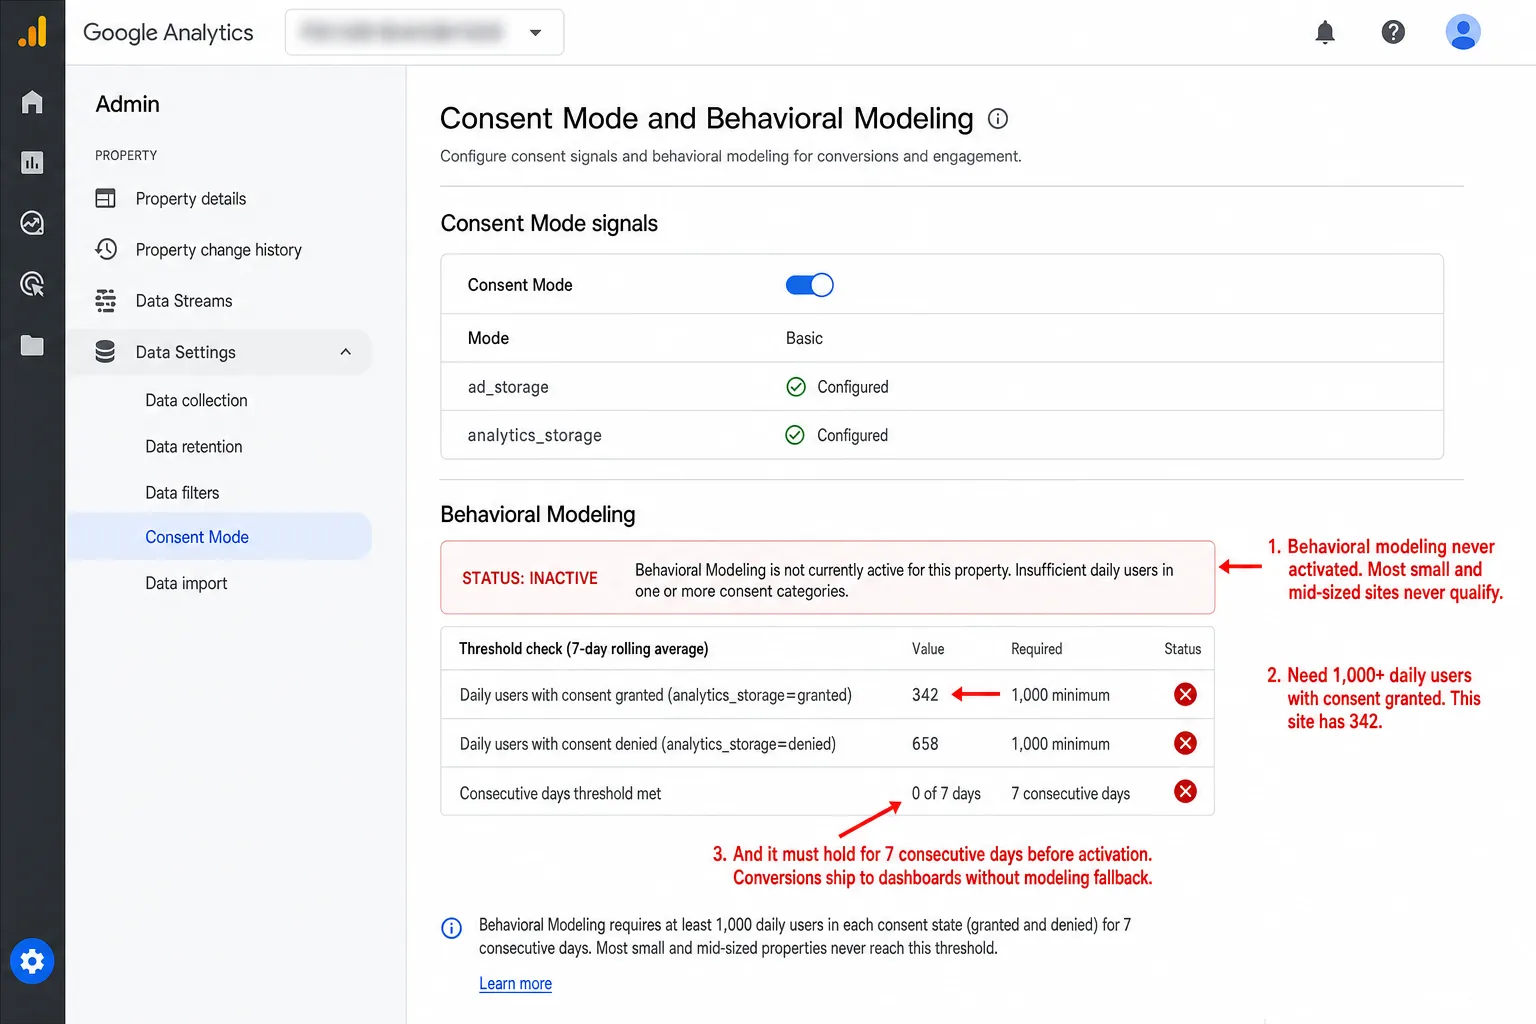
GA4's answer to this is behavioral modeling: machine learning that guesses what the people who declined consent did, based on the people who accepted. Google asks for at least 1,000 daily users in each consent category, and it doesn't publish how accurate the guessing is. Worse, GA4 blends the modeled conversions in with the real ones and never marks which is which. So you're making budget calls on a mix of real data and machine guesses, with no way to tell them apart.
Consent banners aren't the only thing breaking attribution. The browsers are doing it too. Safari's Intelligent Tracking Prevention caps JavaScript-set cookies at 7 days. Firefox's Enhanced Tracking Protection blocks third-party cookies out of the box and strips tracking parameters in Strict mode. Brave blocks analytics scripts outright.
Put them together. Safari (16.7%), Firefox (4%), and Brave (1%+) add up to roughly 20-25% of web traffic that comes with serious tracking limits. Which means a quarter of the web fights your cookies before consent even comes up. So a quarter of the web's fighting your cookies before consent even comes up. And these aren't random people. They skew privacy-conscious and higher-income. You're losing a specific, valuable slice of your audience.
Cookieless analytics tools like Clickport make this whole problem go away. No cookies means no consent banner. No consent banner means you see the visitors GA4 loses at the banner. And last-touch attribution on that fuller picture beats data-driven attribution on a third of it, every time.
(If you want to go deeper, I've written separate guides on how cookie-free analytics works and what the EU regulations really say.)
UTM parameters: the last attribution signal that actually works
Cookies expire. Consent banners block tracking. Browsers strip click IDs. Through all of it, UTM parameters keep working. They're the survivors. They're one of the few attribution signals that survive everything thrown at them.
UTM parameters are tags you bolt onto a URL to tell your analytics tool where the traffic came from. When someone clicks a link carrying ?utm_source=newsletter&utm_medium=email&utm_campaign=march-2026, your tool records exactly which campaign sent that visit.
So why do UTMs survive when everything else falls over?
Because of what they describe. Apple's Safari 26 Link Tracking Protection, shipped in September 2025, goes after the click IDs that identify a person: gclid, fbclid, msclkid. It strips them from URLs across every browsing session. But it deliberately leaves the campaign-style parameters alone: utm_source, utm_medium, utm_campaign. A UTM tells you about the campaign, not the person. There's nothing for a privacy law to object to.
The five parameters
utm_source (required): WHO sent the traffic. The exact platform or publisher: google, linkedin, newsletter, partner-blog.
utm_medium (required): HOW it arrived. The channel type: cpc, email, social, paid_social, referral, affiliate. This is the one that drives channel classification in GA4. Get the medium wrong and you get the wrong channel group, which usually means "Unassigned" traffic.
utm_campaign (required): WHAT initiative. The campaign name: black-friday-2026, product-launch-q1. Keep it identical across channels so you can compare sources inside the same campaign.
utm_term (optional): WHICH keyword or subject. It started life for paid-search keywords. People now use it for email subject lines and audience segments too.
utm_content (optional): WHICH variation. It tells apart creative versions, placements, or CTAs: header-cta, sidebar-banner, blue-button.
Good vs. bad UTM tagging
Here are the mistakes that quietly break UTM attribution:
- Inconsistent capitalization. GA4 reads UTM values as case-sensitive. "Facebook", "facebook", and "fb" become three separate sources, and your one channel splits into three.
- Tagging internal links. Put UTMs on a link between your own pages and you reset the session and overwrite the original source. A visitor arrives from a Google ad, clicks an internal banner that's tagged, and the conversion gets handed to "homepage-banner" instead of the ad that paid for it.
- Missing parameters. Tag the paid ads but forget the newsletter links, the social posts, the podcast descriptions, and you've drilled blind spots into your own data.
- Redirect chains dropping parameters. 301 and 302 redirects don't carry query parameters unless you tell them to. Every redirect between the click and the landing page is one more chance to lose your UTMs.
Most companies have no written UTM naming convention, and the messy tagging that follows costs them a lot of data. The fix isn't clever. Pick a convention, force everything to lowercase, and keep one shared spreadsheet as the single source of truth.
Dark traffic: the visitors your analytics can't see
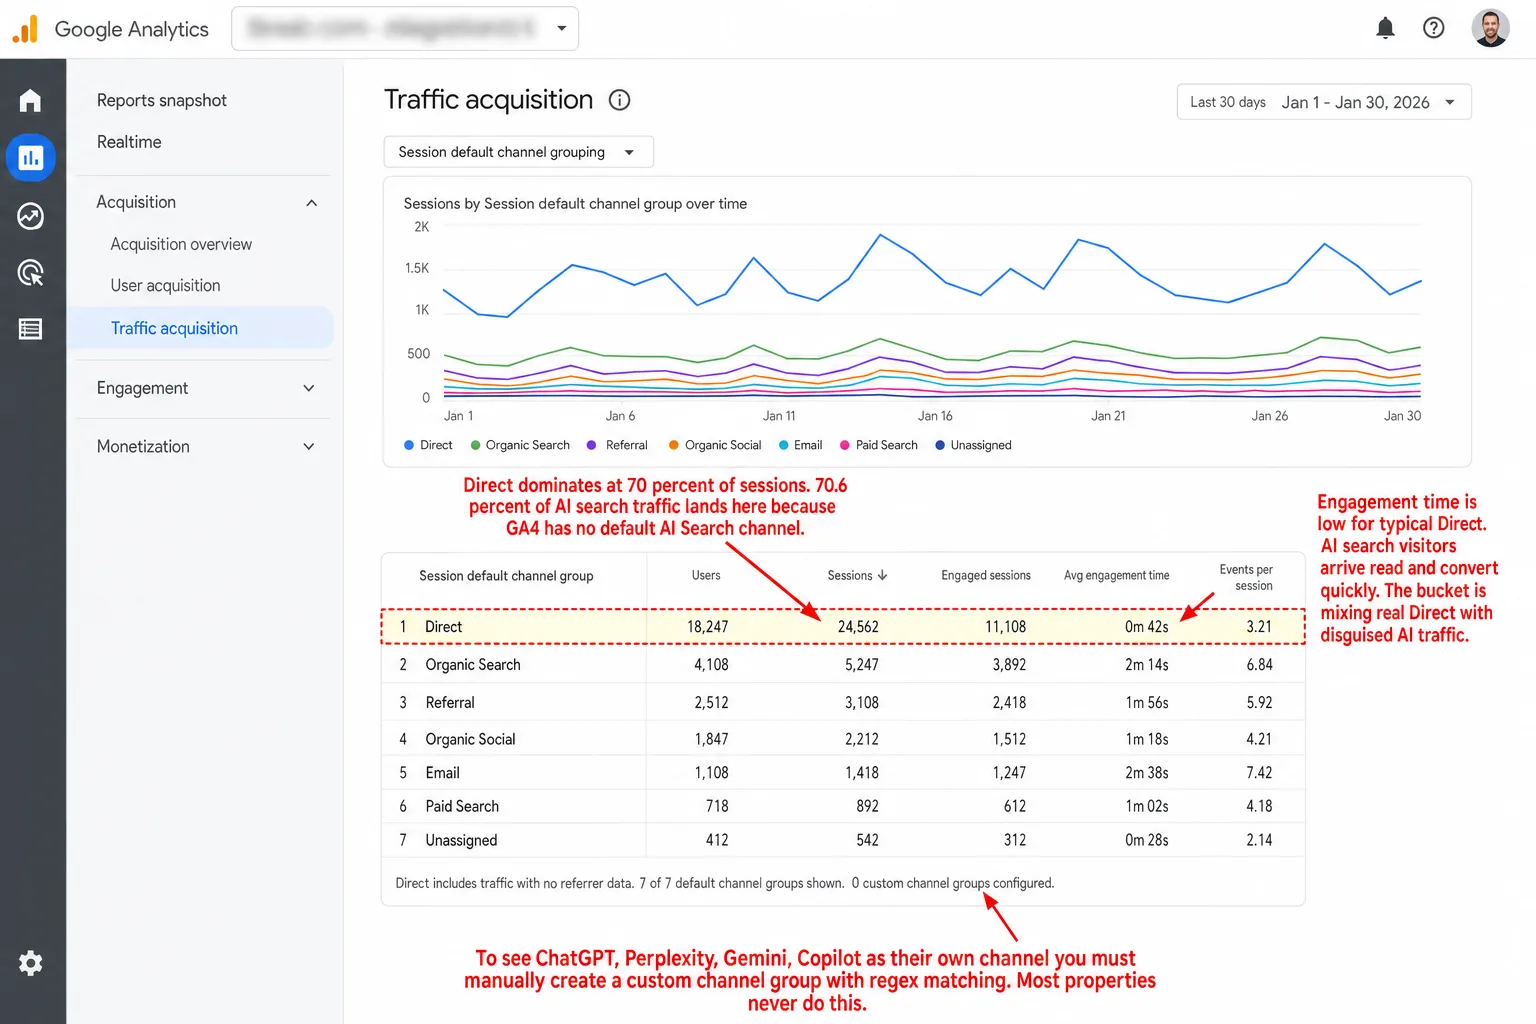
Even with perfect UTM tagging and a cookieless tool, a big chunk of your traffic shows up as "Direct" when it's nothing of the sort. This is dark traffic.
The most famous proof came from Groupon. They deindexed themselves from Google for 6 hours as an experiment and watched 60% of the "Direct" traffic to their long-URL pages disappear. In plain English: that traffic was organic search all along. That traffic wasn't direct. It was organic search, and GA had been filing it under Direct the whole time.
SparkToro tested 1,113 visits across 16 pages on 11 platforms and found referral data gets stripped almost everywhere:
- 100% of visits from TikTok, Slack, Discord, WhatsApp, and Mastodon showed as "Direct"
- 75% of Facebook Messenger visits lost referral data
- 30% of Instagram DM visits lost referral data
This is dark social: links passed around in messaging apps, email clients, and private channels that strip the referrer header before the click ever reaches your site. RadiumOne's research found that 84% of online sharing happens through these dark channels, not out on public social media. Put another way: most sharing is invisible by design. So most sharing is invisible by design.
What does that mean in practice? Your "Direct" bucket is a junk drawer. Yes, it holds real direct visits, the people who typed your URL. But it also holds misattributed organic search, email clicks that lost their referrer, links shared in private messages, in-app browser visits, and, more and more, AI search clicks.
No model can fully untangle dark traffic. But once you know the "Direct" bucket is inflated, you read every other channel differently. If 60% of your Direct traffic really came from somewhere else, then your organic search, your social, and your email are all doing better than the dashboard gives them credit for. Your best channels are stronger than they look.
AI search traffic: the attribution blind spot nobody's talking about
AI search engines now drive an estimated 12-18% of total referral traffic as of Q1 2026, up from 5-8% in late 2024. That means a doubling in roughly a year. And the growth rate is steeper still: AI referral traffic is rising 130-150% year-over-year. Which means it's more than doubling every year. Early data also suggests it converts a lot better than ordinary organic search.
So this may well be your best-converting traffic source. And most analytics tools can't see it at all.
The trouble is that every AI tool handles referrer data its own way:
The root of it: GA4 has no default "AI Search" channel. So all of it lands in "Referral" next to your normal website referrals, or, worse, in "Direct" when the referrer is missing. To pull it out, you have to build custom channel groups by hand, with regex matching for each AI domain. Most people never do.
Google's own AI Mode traffic was untrackable in GA4 at first. I want you to sit with that for a second. Google couldn't attribute traffic from its own AI product inside its own analytics tool. If that's where the maker of both is, you can guess where everyone else is.
Clickport ships with a dedicated AI Search channel baked into its 16-channel classification. Traffic from ChatGPT, Perplexity, Gemini, Copilot, and the rest gets spotted and grouped on its own, with no regex for you to write. (I've also written a longer piece on why AI visibility scores are misleading if you want the wider view of AI search.)
The small business attribution stack (that costs $0-9/month)
I'll say the quiet part out loud. If you're a small business with 2-5 marketing channels and under 100K monthly pageviews, you don't need multi-touch attribution. You need three cheap things, and they cost almost nothing.
Most marketers don't trust the attribution model they're using. But for a small business, the problem usually isn't the model they picked. It's that they're trying to solve an enterprise problem with enterprise tools when something far simpler would do the job better.
Layer 1: Cookieless analytics with source tracking ($0-9/month)
Any privacy-first analytics tool grabs referrer data, UTM parameters, and channel info on its own. And because there's no consent banner in the way, you keep data from all your visitors instead of the 30-40% who say yes to cookies.
That alone hands you last-touch attribution on every single visit. For most B2C businesses, where the buyer shows up and converts in one session, last-touch on the fuller picture is more accurate than data-driven on 30% of it. The simpler tool wins because it sees more.
Layer 2: UTM-tagged links on everything you control ($0)
Newsletter links, social posts, bio links, partner links, podcast descriptions. A shared Google Sheet holding your naming convention is your single source of truth. Three rules keep it clean: always lowercase, hyphens between words, and a date on any time-bound campaign.
Layer 3: "How did you hear about us?" ($0)
One dropdown, or one text field, on your signup form or checkout page. Post-purchase surveys get 60%+ response rates. That means most buyers will just tell you. And they tell you what no analytics tool can see: the podcast mention, the friend's recommendation, the conversation at a conference, the private message from a colleague.
This question is your only window into dark social, and dark social is over 80% of content sharing.
Now compare that to enterprise attribution tools at $50,000-200,000+ a year. For a business with a few thousand monthly visitors and straightforward marketing, this three-layer stack gives you 90% of the insight at 1% of the cost. The math there isn't subtle.
One practical tip I lean on: put your first-touch and last-touch views side by side. If they name the same top channel, you can trust it. If they disagree, that gap is teaching you something real about your funnel, and you learned it without a single line of modeling.
How to set up attribution that works today
Here's the playbook I'd hand a friend, and I mean that literally. No enterprise tools, no data science team, no six-figure budget.
Step 1: Tag every link you control with UTMs. Newsletter links, social posts, bio links, partner referrals, podcast show notes, QR codes on print materials. Run it all through a shared spreadsheet to keep the naming clean. Always lowercase, hyphens between words, dates on time-bound campaigns.
Step 2: Pick a cookieless analytics tool. That gives you source and channel data on every visitor, with no consent banner. Clickport does this, and so do the other privacy-first tools. The win is what you stop losing: no data thrown away by cookie rejection, no behavioral modeling stirring guesses into your real numbers.
Step 3: Set up goals for your conversions. Decide what a conversion is for you: a signup, a purchase, a form submission, a demo booking. Without a goal, attribution has nothing to attribute. Clickport handles goal tracking for pageviews, clicks, form submissions, and custom events.
Step 4: Add "How did you hear about us?" to your signup or checkout flow. Keep it simple. A dropdown with your main channels and an "Other" text field. This is the one signal you'll ever get for dark social, word-of-mouth, and the offline touchpoints no script can catch.
Step 5: Review your sources weekly. See which channels bring visitors and which ones drive conversions. Compare first-touch (your entry pages) with last-touch (the converting session's source). A channel that brings lots of first visits but few conversions is an awareness channel. One that brings few first visits but converts hard is a closing channel. You want both.
Step 6: Clean up "Direct" traffic. If Direct is your biggest source, something is broken. Check that your email links carry UTMs, that your bio links are tagged, and that no redirect is eating your parameters. A spike in Direct right after a campaign launch almost always means the campaign links are broken.
Attribution doesn't ask for clever models, and I wish more people believed that. It asks for consistent tagging, a tool that sees all your visitors, and the discipline to look at the data every week. The companies that get this right aren't the ones with the fanciest algorithm. They're the ones that'll tag every link and then go read the results.
If you want to see your attribution measured across all the traffic your banner used to hide, with channels classified for you (AI Search included), try Clickport free for 30 days. You'll see your sources sorted across 16 channels in real time.
And if your Direct bucket looks wrong and you can't work out why, email me a screenshot. I answer every email.

Comments
Loading comments...
Leave a comment