Google Traffic Dropped: What Did It Cost Your Business?
A Google traffic drop creates an expensive question: should you fix rankings, your website, or your measurement? I want to answer that before starting another SEO project. This guide follows a visitor from Google to a meaningful business action, then checks what changed across two comparable periods.
The answer starts with recorded leads, orders, or subscriptions. Compare those outcomes for Google traffic before estimating what the missing visits could have produced. Your landing pages help you find where to investigate.
Growth Memo's Growth Intelligence Brief #24 prompted this check. Its preview reports a 2.4% decline in its search visibility index over the August 10–31 window. That's a change in search visibility. It doesn't tell you what your business lost as the mix of AI and Google traffic changes.
- Check 3 separate measurements: Google Search clicks, analytics sessions, and confirmed business outcomes. A visibility loss alone does not establish lost sales.
- Compare equal, complete periods with the same weekdays. Two 21-day windows each contain three Mondays, three Tuesdays, and three of every other weekday.
- In the worked example, sessions fall 40% while revenue falls 10%. The figures are illustrative, not Clickport customer results.
- The calculator holds your baseline conversion rate and value constant. Its estimated effect is separate from recorded revenue and does not prove cause.
- Give trial groups the same time to pay. Installing a tracker cannot recover historical conversions or payments that were never recorded.
Which Google number fell?
Start with three records: Search Console clicks, Google organic sessions, and confirmed business outcomes. A ranking tool measures something else again. If one report falls while the others hold steady, check its collection and definitions before treating the change as lost business.
Google's own guide explains the difference between Search activity and behaviour on your website. Clicks and sessions won't match exactly. Don't multiply a Search Console click gap by an analytics value per session.
- Search clicks
- Did fewer people click through from Google?
- Organic sessions
- Did analytics record fewer visits from Google?
- Business outcomes
- Did confirmed leads, orders, or subscriptions change?
Test your signup or checkout flow. Check recent website and tracking changes. Google's traffic-drop guide also covers indexing, seasonality, and search demand. Its Search Console Data anomalies page helps identify known reporting problems.
How should you compare the two periods?
Use two complete periods of equal length with the same weekdays. A 21-day period includes each weekday three times. That means weekends take the same share of both comparisons. Keep the source filter, event definition, and reporting time zone unchanged. Then check a longer view for seasonal demand and changes in your offer.
I checked whether Clickport customer data could support a revenue comparison for those dates. It couldn't: the eligible records contained no recorded revenue events. Generic form events also didn't establish qualified leads. I won't turn missing measurement into a lost-sales claim.
The examples below therefore use illustrative figures. They're calculations you can repeat with your own records.
For seasonal businesses, also check the equivalent period last year. Google recommends longer context and careful comparisons. I leave incomplete days out of this check. GA4 reports can change during processing.
Did fewer visitors become customers?
In this example, Google sessions fall 40%, while attributed revenue falls 10%. Purchase sessions fall more slowly than visits. Compare both the number of outcomes and the rate. A better rate can coexist with fewer completed purchases.
| Measure | Before | After | Change |
|---|---|---|---|
| Sessions | 10,000 | 6,000 | −4,000 |
| Sessions with a purchase | 200 | 150 | −50 |
| Session conversion rate | 2% | 2.5% | +0.5 pp |
| Attributed revenue | €20,000 | €18,000 | −€2,000 |
The rate rises from 2% to 2.5%, but purchase sessions fall from 200 to 150. That means 50 fewer sessions with a purchase. Repeated button clicks don't count as extra customers.
GA4's session key event rate uses sessions with a selected key event divided by sessions. Choose an event that matters to the business. A completed order qualifies; a click toward checkout doesn't confirm payment.
Which landing pages deserve attention first?
Break the change down by the page where each session started. In the example below, product pages account for 72% of the decrease in purchase sessions. That means 36 of the 50 fewer purchase sessions started there. I would check those pages before prioritising the larger traffic decline on help articles.
| Entry page group | Session change | Purchase sessions |
|---|---|---|
| Help articles7,000 → 3,800 sessions | −3,200 | 40 → 32 (−8) |
| Product pages2,000 → 1,400 sessions | −600 | 120 → 84 (−36) |
| Other pages1,000 → 800 sessions | −200 | 40 → 34 (−6) |
There's a reported example of this distinction. SureSwift's Storemapper case describes falling trial signups while traffic, new paid customers, and revenue held steady. Search Console revealed declines on the homepage, pricing page, and demo page. It was one company's investigation, not a general conversion benchmark.
I would inspect pages with a material outcome change first. Then check tracking, availability, search demand, and the path to purchase. GA4's Landing page report uses the first pageview of the session. A page viewed later answers a different question.
How much could the missing traffic be worth?
The calculator estimates what a traffic change means if the baseline conversion rate and value stay constant. With 4,000 fewer sessions, a 2% rate implies 80 fewer converting sessions. At €100 each, that's €8,000 less estimated value. The illustrative comparison table shows a €2,000 revenue decrease.
The formula holds two assumptions fixed. The real business may have a different page mix, price, offer, or conversion rate. Keep the recorded result beside the estimate. Neither a before-and-after chart nor this formula proves that a Google update caused the difference.
Don't assign an order value to an unqualified form submission. If you only know trial starts, use the outcome estimate and leave monetary value blank.
When do trial starts become paying customers?
A trial start and a paid subscription happen at different times. Choose an endpoint, such as a completed first payment within 30 days of signup. Give every signup that full window before comparing groups. Use a longer window if your customers usually pay later.
Count completed first payments separately from renewals. Keep refunds and reporting currency consistent. A price multiplied by an assumed customer lifetime is a forecast, even when the first payment is real.
This is why I wouldn't promise a paid-customer verdict immediately after installing analytics. You need measured arrivals, defined actions, and enough time for customers to decide.
How do you repeat this check in Clickport?
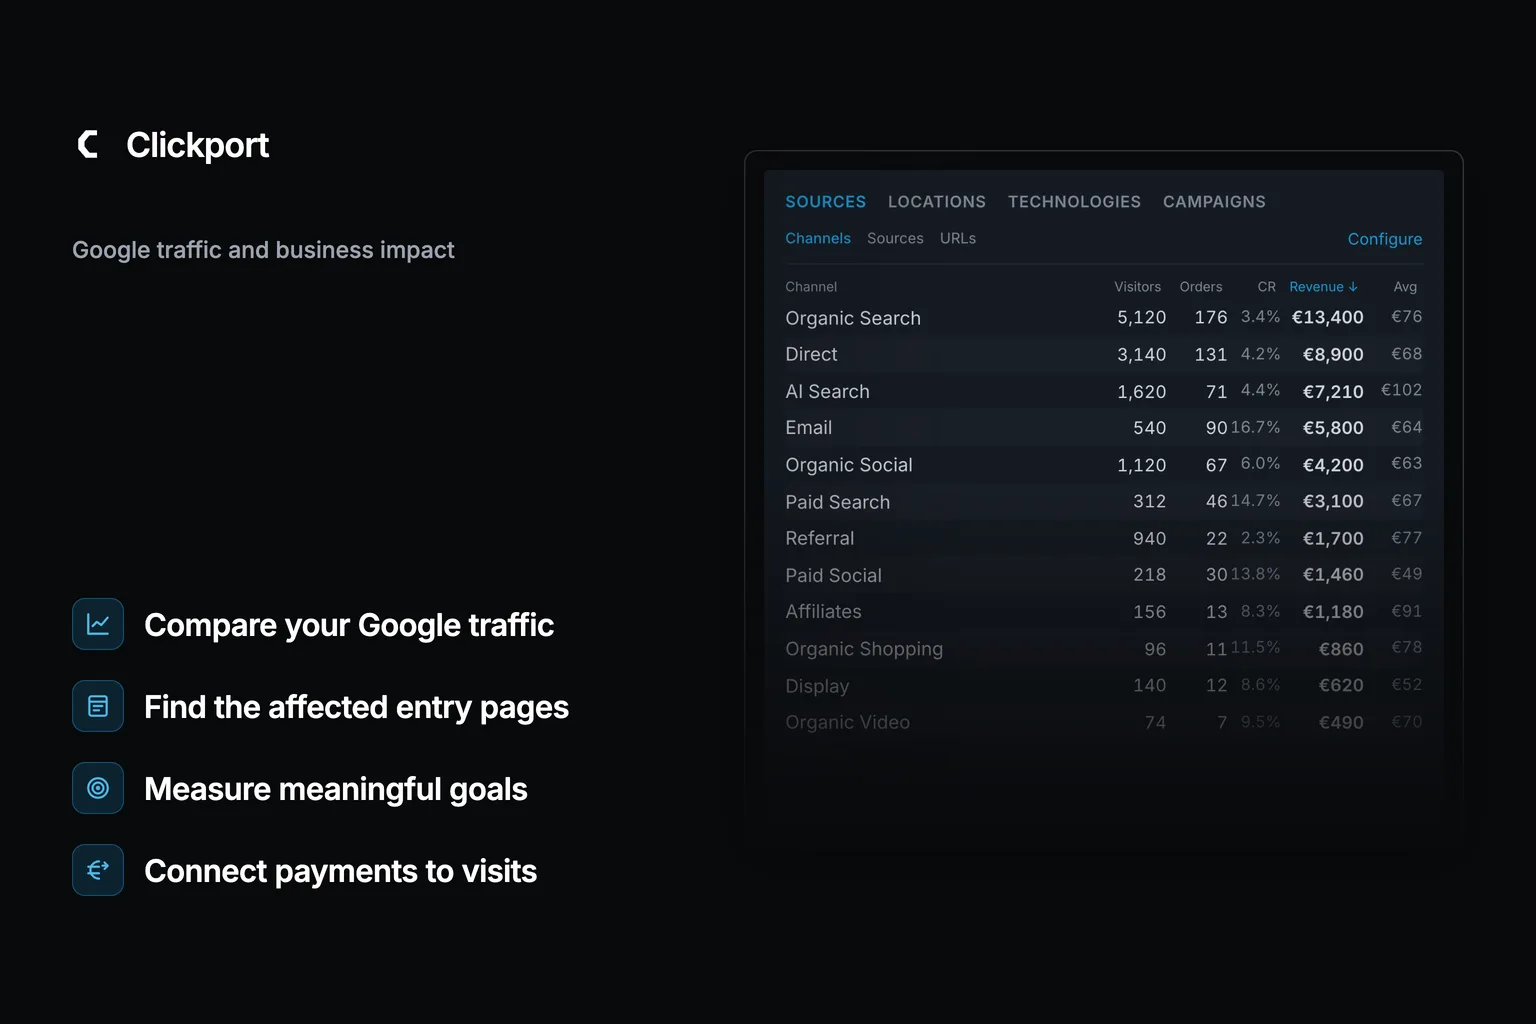
Use both Source: Google and Channel: Organic Search to isolate Google organic traffic. Then inspect entry pages and the business goal you chose. Keep the periods and definitions consistent. Use the calculator's Visitors setting with Clickport's visitor-based goal rate and visitor counts.
Add an Entry page filter for a specific landing page. Clicking an Entry row applies the broader Page filter, which includes pages viewed later in a session.
- Filter the acquisitionSource is Google · Channel is Organic Search
- Set the comparison periodsRead each explicit date range. Check the comparison label.
- Open Pages → EntryRead where sessions started. Use the Entry page filter for a landing-page segment.
- Check the goal and payment recordsKeep estimated goal values separate from attributed payments.
Clickport's comparison can use a smart baseline. For a specific before-and-after check, read each explicit date range. Don't assume the default comparison is your chosen earlier period.
You can connect payments with the Stripe or Paddle integration. Checkout attribution needs a session reference. Clickport cannot assign payments without that link to a tracked Google visit. Fixed goal values are estimates.
GA4 can also report landing pages, key events, and revenue. If that setup answers your question reliably, use it. I think Clickport is useful when you want a simpler, repeatable view of sources, entry pages, goals, and attributed payments.
Imported history can preserve supported traffic reports. It doesn't recreate unrecorded conversion or revenue events. Start collecting the missing evidence for the next comparison.
Measure the business before changing the plan
A traffic decline deserves a check. The result determines the work: repair measurement, investigate valuable landing pages, or wait for incomplete sales groups to mature. Keep the three records together so the next change is easier to understand.
| What you see | What to check next |
|---|---|
| Only analytics declines | Tracking, consent changes, and report definitions. |
| Visits and qualified outcomes decline | Affected entry pages and the path to purchase. |
| Visits decline; outcomes hold | Traffic mix and outcomes that take longer to appear. |
| Recent trials have fewer payments | Equal observation time for both signup groups. |
I would put the measured business change at the top of the report. That's the number your next decision needs. If you have to explain the drop to a boss or a client, SEO reporting when traffic is down shows how to add impressions and brand searches to that report.
You can try Clickport free for 30 days, with no credit card required, to start measuring those visits and actions. The guide to switching from Google Analytics covers the setup and the history you can bring with you.

Comments
Loading comments...
Leave a comment