Product Hunt Launch Analytics: What to Watch on Launch Day
It's a few minutes past midnight in San Francisco, your launch is live, and you refresh your Product Hunt page every few minutes. The upvotes tell you people like the idea. They don't tell you who visited, what they read, or whether anyone signed up. That's what your analytics is for, as long as it's ready before the first visitor arrives.
We relaunch Clickport on Product Hunt on Sunday, 11 October, so I've been thinking about launch day from both sides: as a maker refreshing the page, and as the person who builds the dashboard. Below are six example launches and what each team would look for in its numbers, from the first hour to the week after. The products are made up. The dashboard panels are real Clickport reports, filled with the example numbers.
- Set up two goals and tag your Product Hunt link before launch day.
- Watch the Realtime view and 404 pages in the first hours to catch broken links.
- Compare Product Hunt visitors with your usual traffic on the same signup funnel.
- Separate launch-day bots from people before you share any numbers.
- A week later, compare sources on visitors, engagement and revenue.
What should you track during a Product Hunt launch?
Track four things on launch day: who arrives and from where, whether they reach your signup, whether anything breaks under the traffic, and how many visitors are people. In the week after, track which sources keep sending visitors and whether the launch brought revenue. Product Hunt shows you upvotes and comments; the rest lives in your analytics.
Most of it needs ten minutes of setup the day before:
- Install the tracker and check that a test visit shows up.
- Set two goals: a signup (the thank-you page or a signup event) and a visit to your pricing page.
- Tag the website link in your Product Hunt listing, for example
https://yoursite.com/?utm_source=producthunt.com&utm_campaign=launch. Clicks from apps, such as Product Hunt's mobile app, and from some browsers can arrive without the page that sent them. With the tag, they still count as Product Hunt instead of Direct, and they land in the same row as the web visits. - Add a traffic alert rule, for example all traffic above 500 visitors, so an email tells you when the wave arrives while you're answering comments.
- Add an annotation on launch morning, so the spike has a label when you look back in a month.
One limit is worth knowing before the day. Clickport credits a signup to the visit it happens in. Someone who reads your page on launch day and comes back three days later to sign up counts under the source of that later visit. If you want to catch those people, ask how they heard about you on the signup form.
Ferngate: are visitors arriving, and where do they land?
Ferngate makes status pages for SaaS teams. The launch goes live at 12:01 am Pacific time, and twenty minutes later the Realtime view shows people arriving from Product Hunt. What it doesn't show is anyone reaching the signup page.
| Missing page | Hits, Realtime view |
|---|---|
| /sign-up | 27 |
| /changelog | 5 |
| /docs/status-api | 3 |
| /integrations/slack | 2 |
| /pricing/teams | 2 |
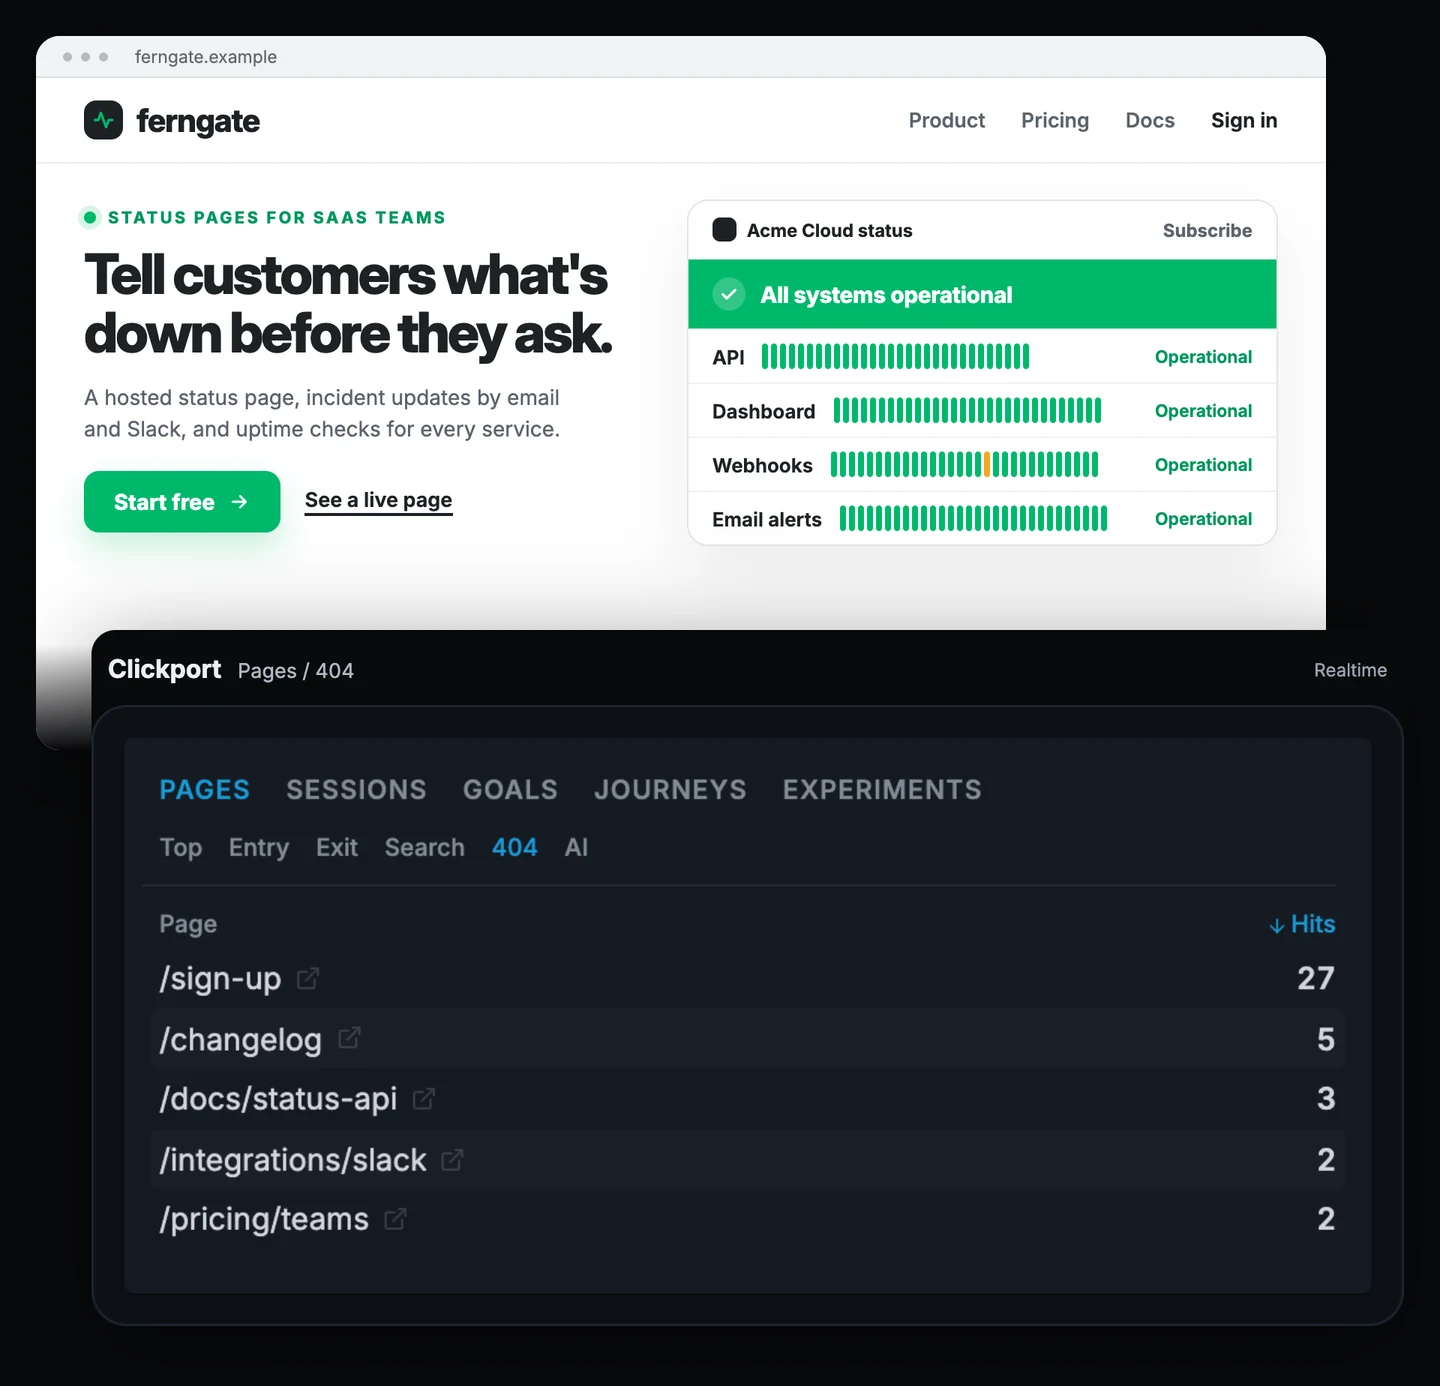
Ferngate's 404 list in the Realtime view, which counts the people on the site right now, as in the figure.
The 404 list explains it. The maker comment links to /sign-up, but the page is /signup. The smaller rows are old links from early posts about the product, worth a redirect each, but not tonight. The broken link got 27 hits from the people on the site at that moment, each from someone who wanted to try the product.
This is the kind of mistake you only find on the day, and the first hours are when it costs the most: the maker comment is one of the first things people read. I'd keep the Realtime view and the 404 list open in a tab for the first two hours. Ferngate fixes the link in the comment and adds a redirect from /sign-up to /signup, in case the old link spreads further.
Shipcue: do Product Hunt visitors sign up like everyone else?
Shipcue sells a changelog widget for SaaS products. By the evening, 1,840 people from Product Hunt have seen the home page, and the team wants to know if they behave like its usual visitors.
| Step | Product Hunt, launch day | Usual day |
|---|---|---|
| Home page | 1,840 | 2,100 |
| Pricing | 610 | 460 |
| Signup form | 205 | 150 |
| Account created | 41 | 78 |
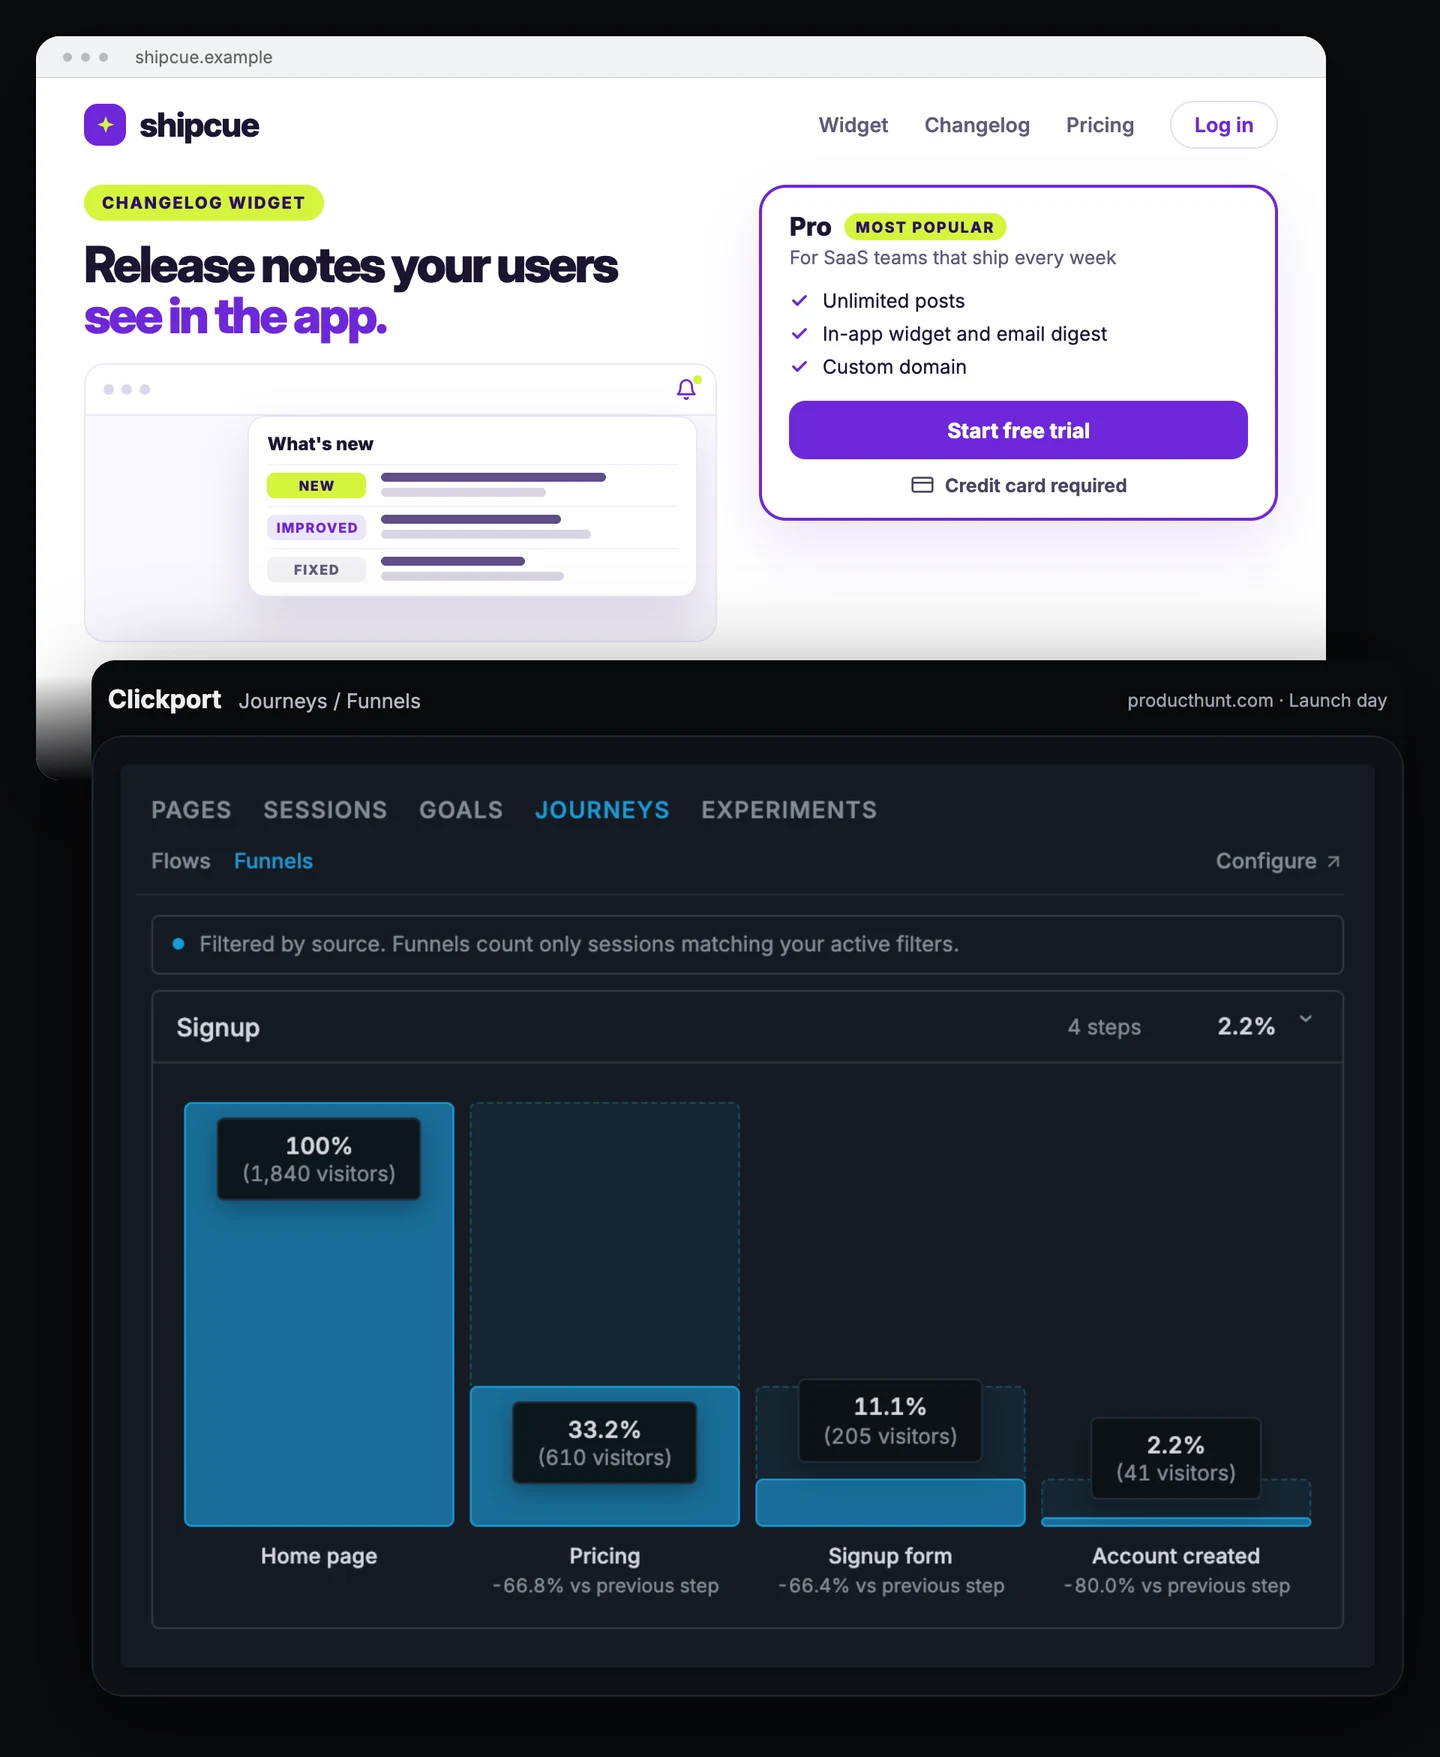
Shipcue's signup funnel in visitors. The Product Hunt column is the figure; the usual day is the same funnel on a normal weekday.
A third of the Product Hunt visitors opened pricing, more than on a usual day. They're curious and they compare. Then the funnel breaks: only 20% of those who opened the signup form created an account, against 52% on a usual day.
The difference is the form. Shipcue's trial asks for a credit card, and a Product Hunt visitor who clicked over between two other launches isn't ready to type one in. I'd offer the free plan in the maker comment and on the pricing page for launch week. The funnel will show within a day whether it helped.
Mockwell: something breaks under the traffic
Mockwell lets you drop screenshots into phone and laptop frames. Its home page has a "Try the editor" button that opens a live demo. On launch day, the demo server slows down, and visitors keep clicking a button that seems to do nothing.
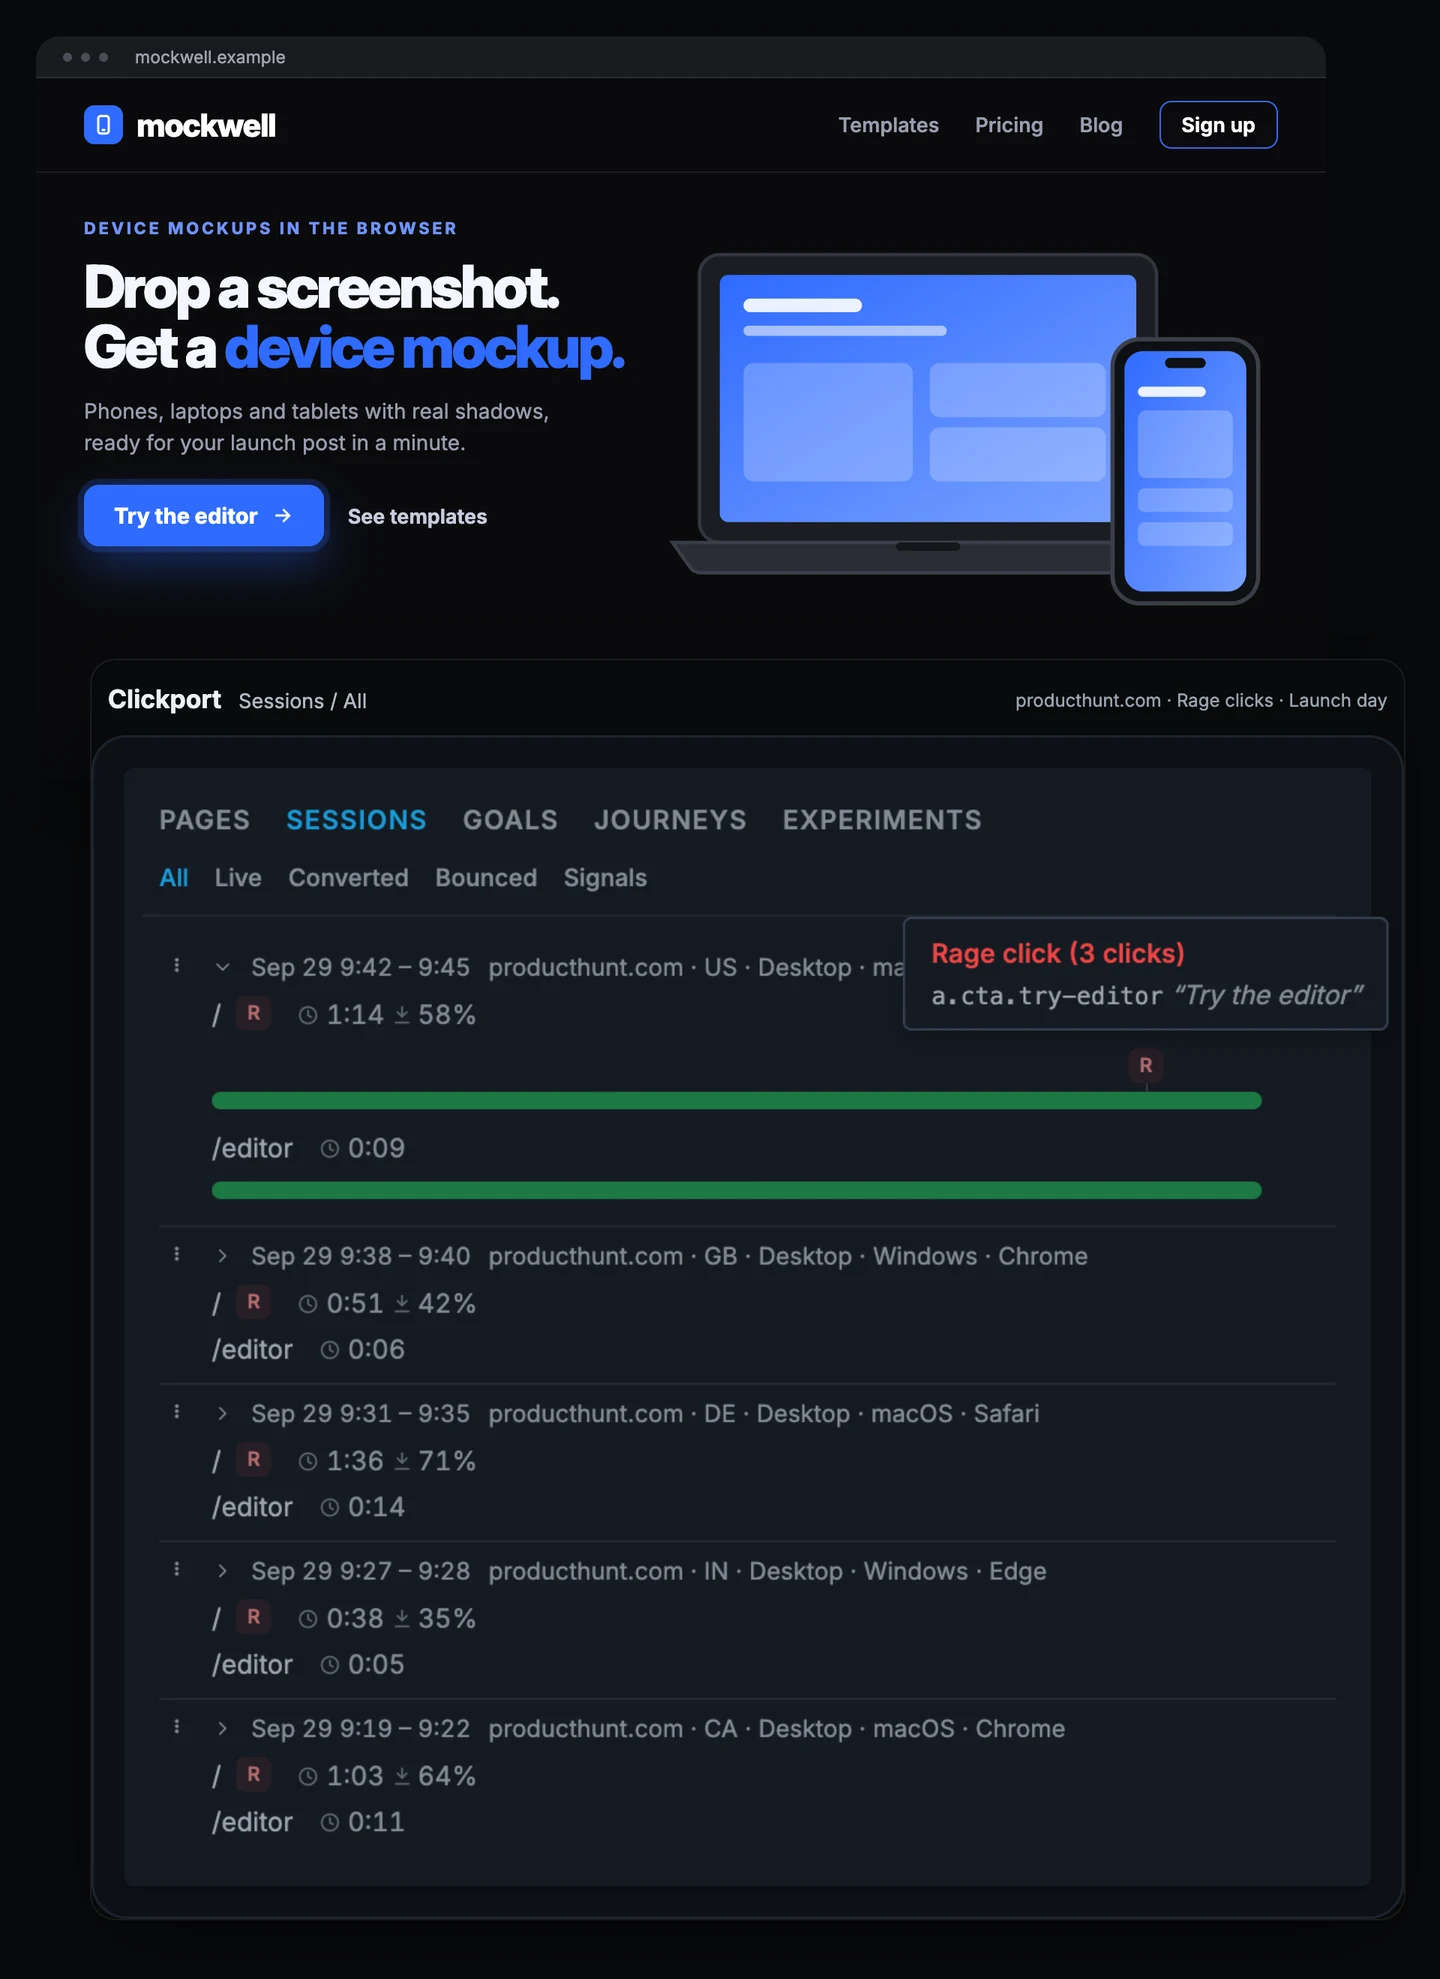
Clickport marks repeated clicks on the same spot as rage clicks, without recording anyone's screen. On launch day, 112 visitors rage-clicked, and 96 of them on "Try the editor". The sessions show the same pattern: a Product Hunt visitor clicks the button again and again on the home page before the slow editor finally opens. Open one of those visits and hover over the R on its timeline, and Clickport names the element and its text, here "Try the editor", with the number of clicks in the burst. Three clicks within a second on the same spot count as one rage click.
Mockwell can't add servers in five minutes, but it can stop the frustration. I'd replace the live editor with a short video for the rest of the day and put a "Try it free" signup next to it. The rage clicks drop as soon as the button does something.
Formrift: how many visitors were people?
Formrift builds form software. Its launch-day chart looks great, and the founder wants to send the numbers to the team and two investors before going to bed.
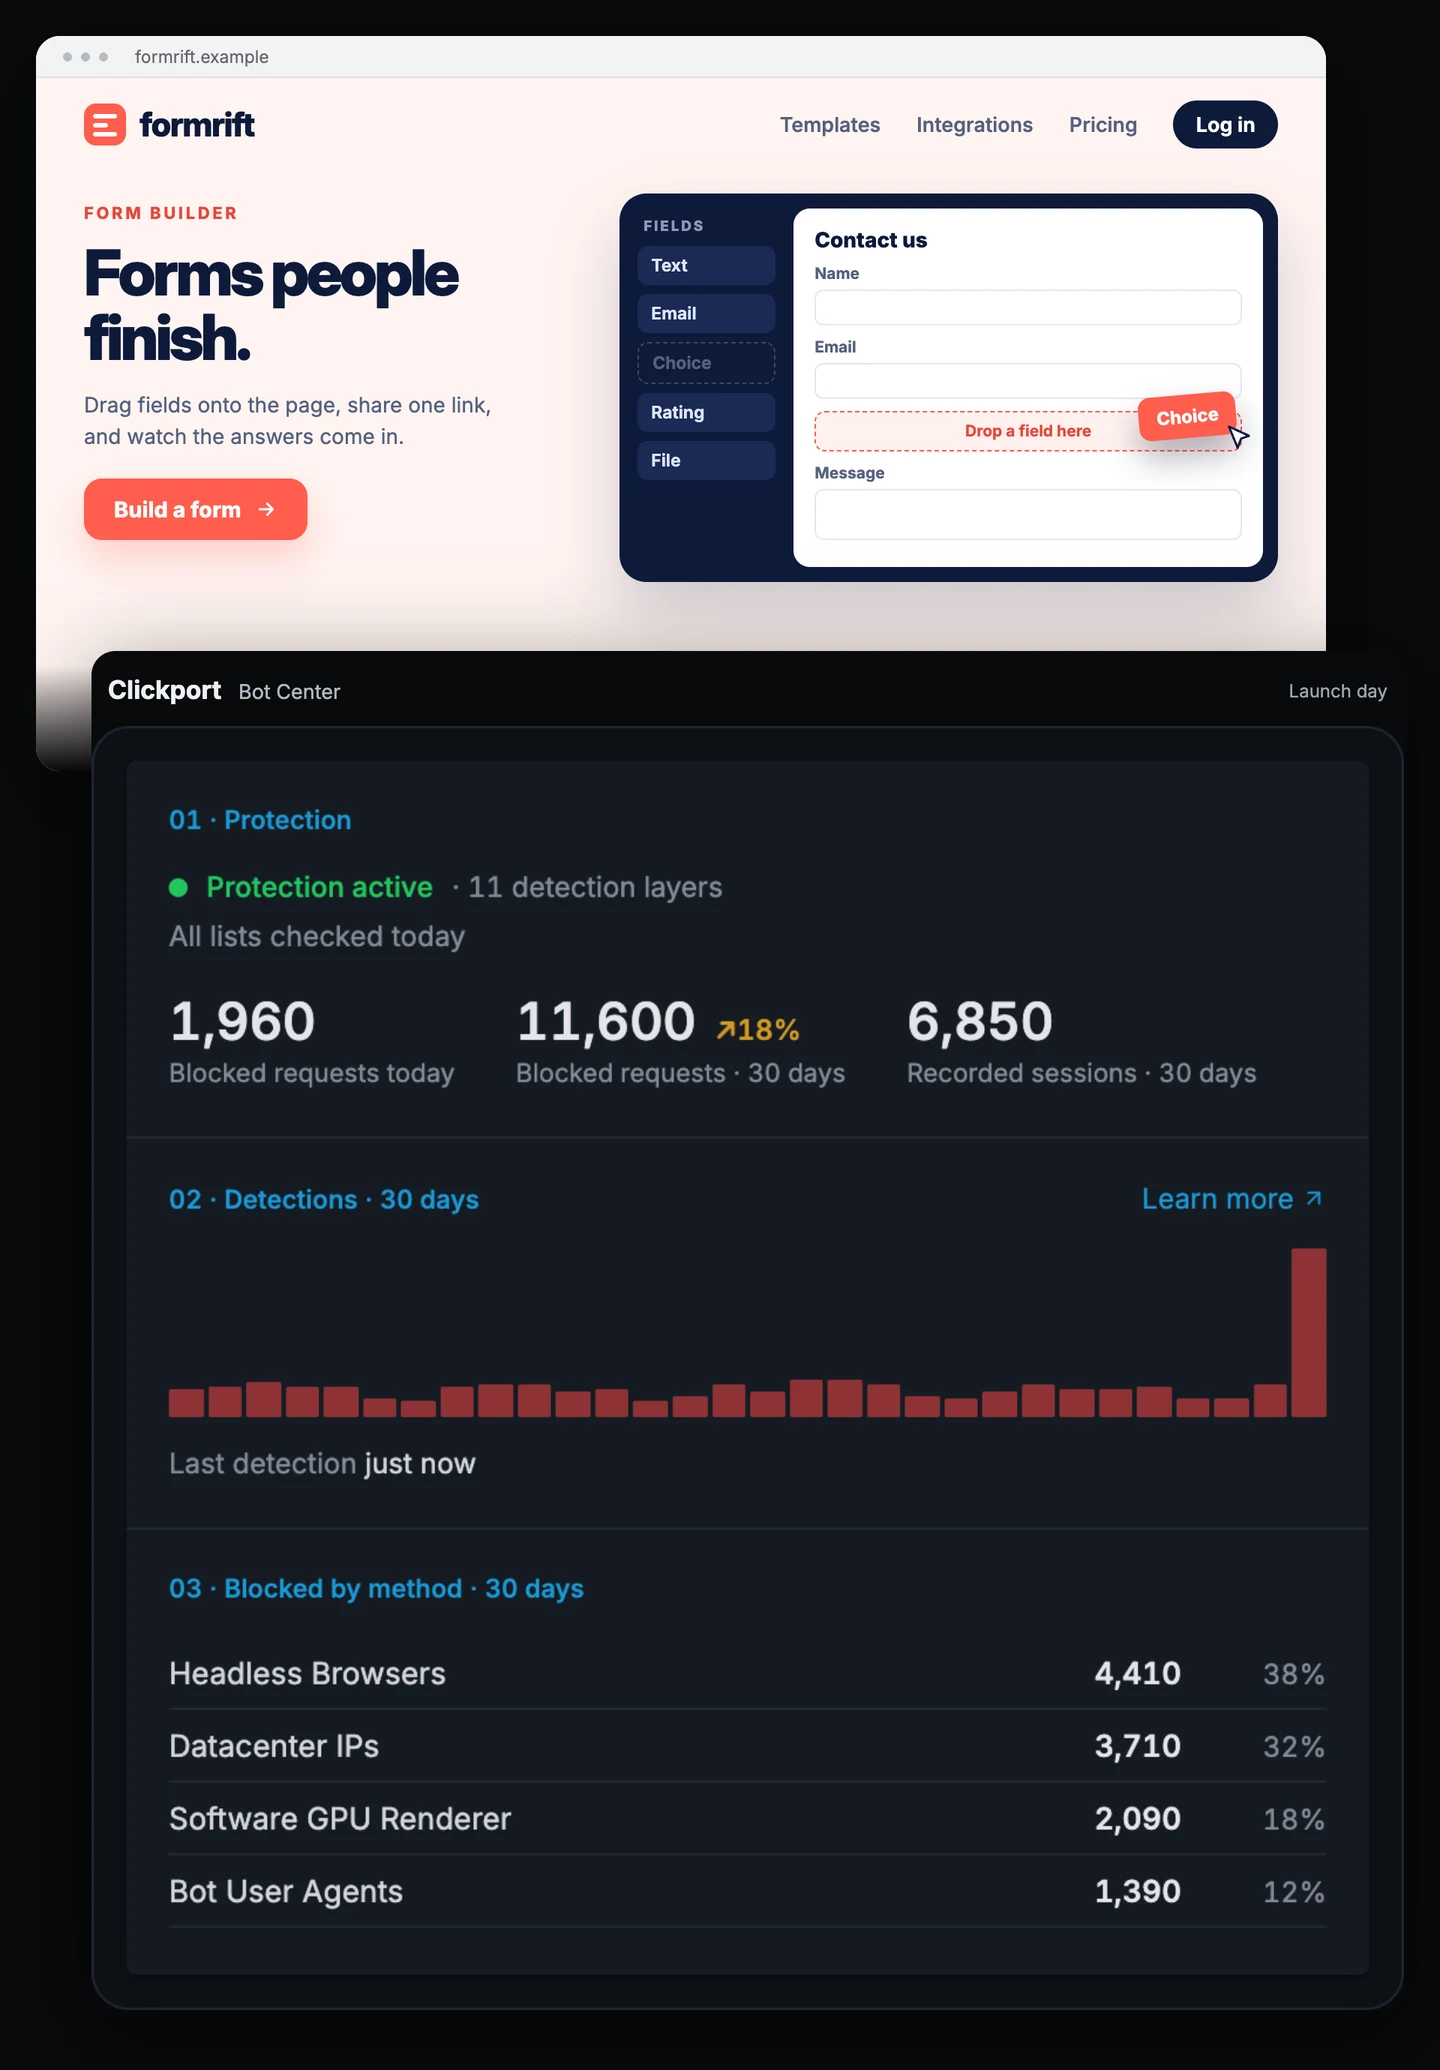
| Detection method | Blocked, last 30 days |
|---|---|
| Headless Browsers | 4,410 |
| Datacenter IPs | 3,710 |
| Software GPU Renderer | 2,090 |
| Bot User Agents | 1,390 |
Formrift's Bot Center, as in the figure. It also shows 11,600 blocked requests over the same 30 days, 18% more than the 30 days before, and 6,850 recorded sessions.
A Product Hunt launch puts your site in front of scrapers, monitoring tools and automated checks as well as people. On a normal day, Formrift's Bot Center blocks between about 200 and 450 requests. On launch day it blocked 1,960 and kept them out of every report, while the dashboard counted 2,430 visitors. The number Formrift sends is 2,430. A server log or a hosting dashboard counts the bot requests along with the people, which makes the day look bigger than it was.
I'd always report the human number after a launch. It's smaller, and it's the one you can compare with next month.
Tallybird: who keeps coming, and who reads?
Tallybird is a habit tracker with a web signup. A week after its launch, Product Hunt has moved on, and the founder wants to know where to put the next week of work.
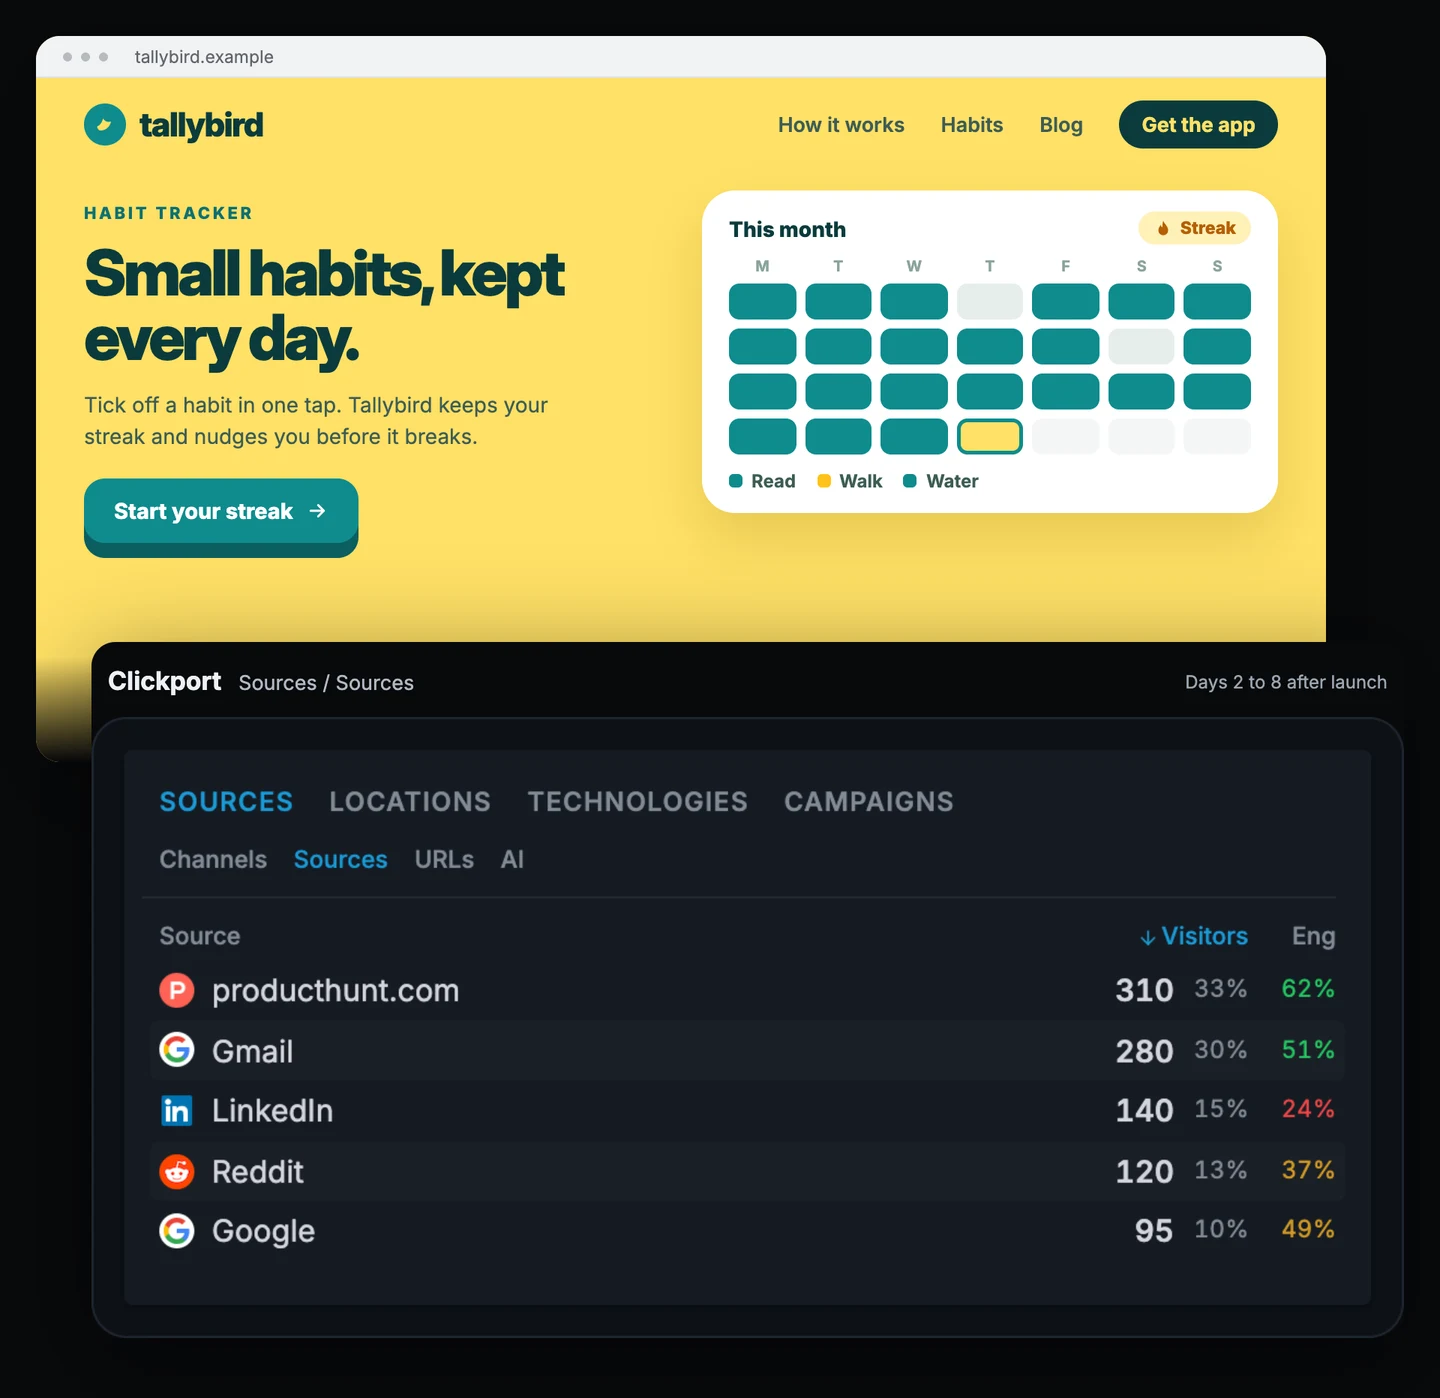
| Source, days 2 to 8 | Visitors | Eng |
|---|---|---|
| producthunt.com | 310 | 62% |
| Gmail | 280 | 51% |
| 140 | 24% | |
| 120 | 37% | |
| 95 | 49% |
Tallybird's sources in the week after launch, as in the figure.
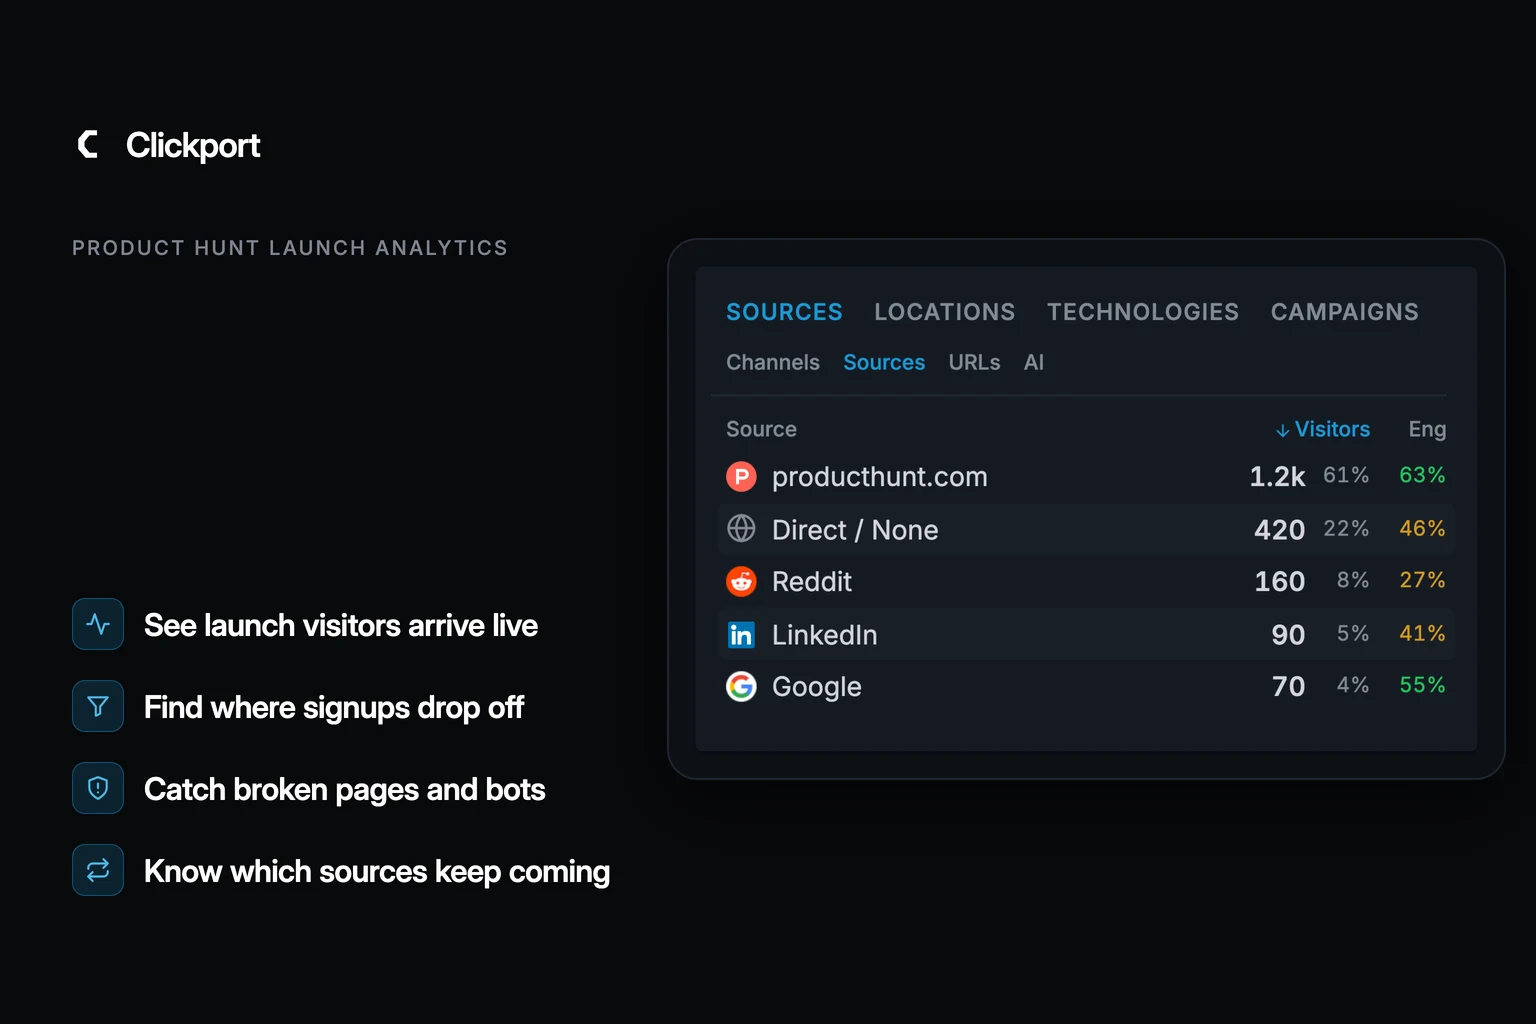
Product Hunt still leads, but it falls every day. The surprise is the second row: a newsletter about habits picked up the launch, and its readers clicked through from their inboxes. Clickport lists them as Gmail, 280 visitors in a week. Reddit and LinkedIn come from people sharing the launch, and Google starts to show up for the product's name.
The Eng column tells you who read. Clickport gives every source an engagement score from 0 to 100 that combines how far visitors scrolled with how long they stayed. The dashboard colors it: green for 50 and up, amber from 25, red below that. Product Hunt visitors score 62%, in green, the highest of any source: people who click through from a launch page read it and try the product. The newsletter readers from Gmail come next at 51%. LinkedIn visitors, at 24% in red, barely looked around.
I'd keep the Product Hunt crowd close: answer every comment, and post an update on the launch page when the next feature ships. For new visitors, I'd work with the newsletter, the one source that kept sending engaged readers: a guest post, a reader offer, a thank-you to the editor. A spike shows you who noticed. The week after shows you who keeps sending people.
Billjar: did the launch pay?
Billjar sells invoicing software for freelancers. For launch week, it offered the annual plan for €40 and took payments through Stripe, which reports each sale to Clickport.
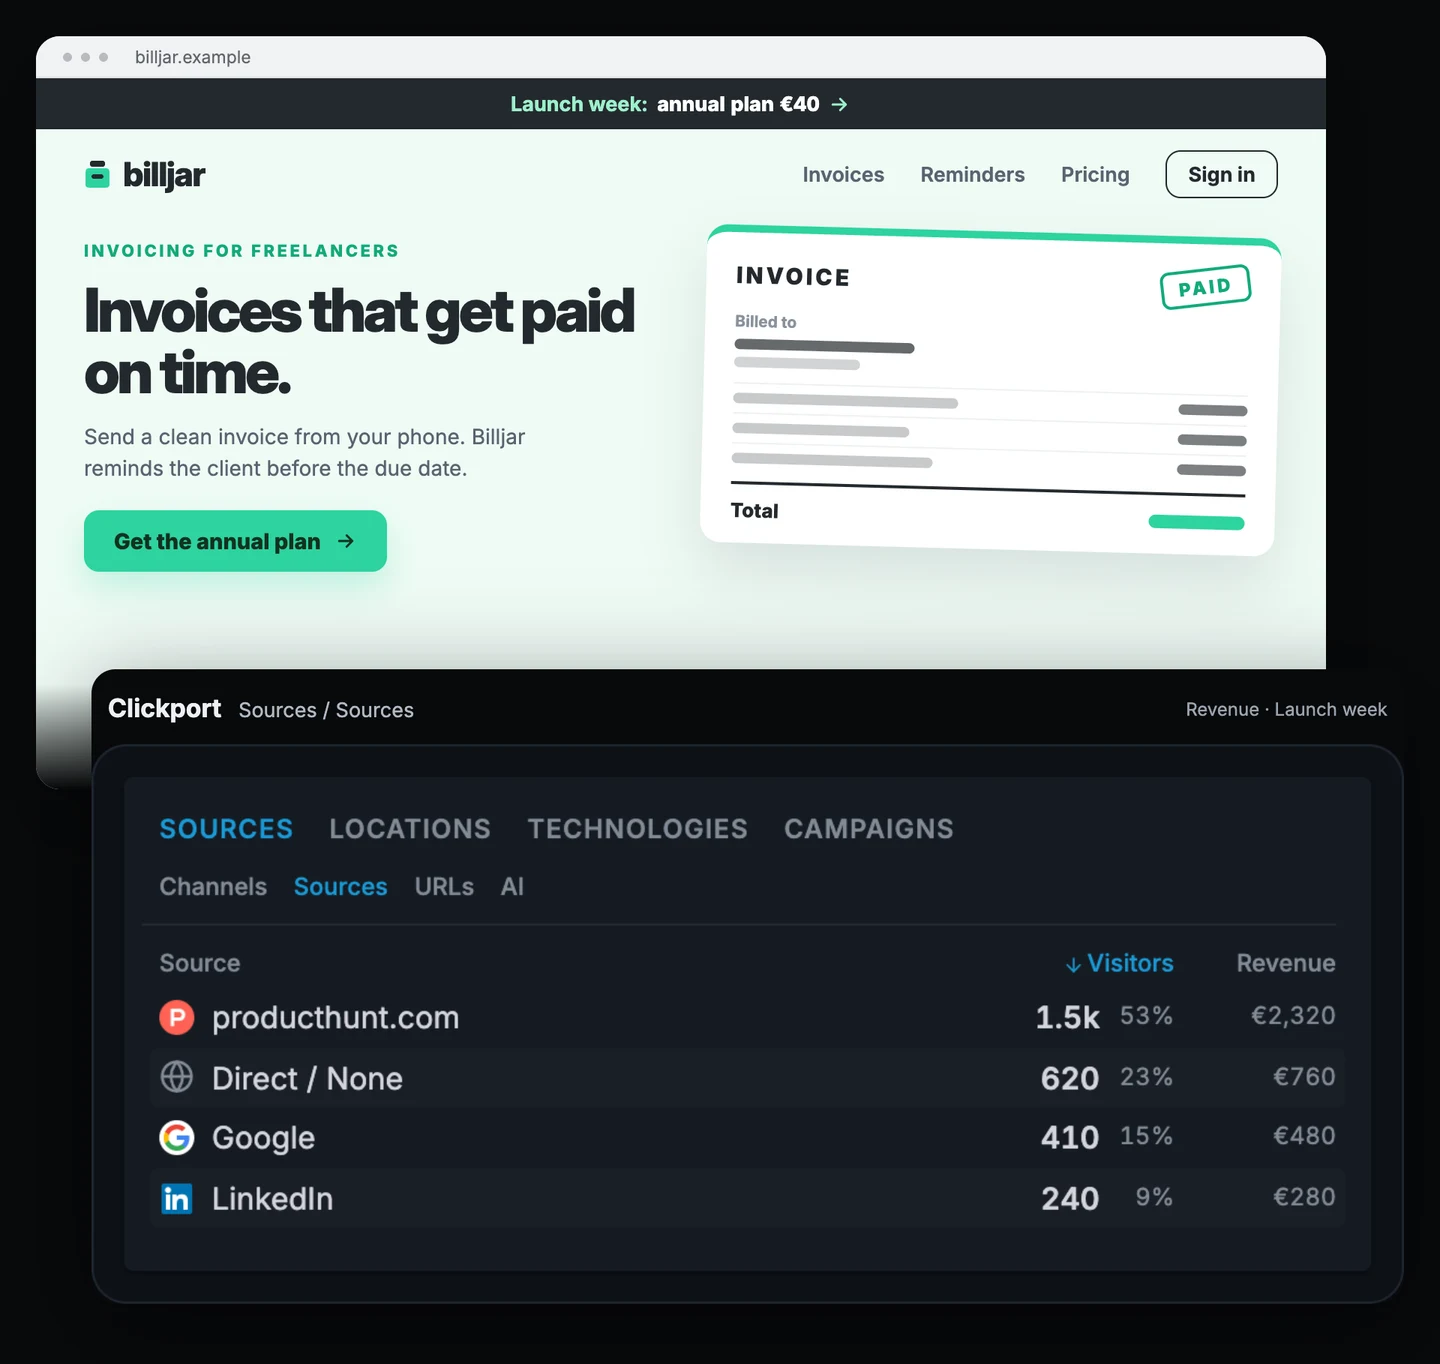
| Source, launch week | Visitors | Revenue |
|---|---|---|
| producthunt.com | 1,450 | €2,320 |
| Direct / None | 620 | €760 |
| 410 | €480 | |
| 240 | €280 |
Billjar's launch week, as in the figure, where 1,450 shows as 1.5k.
Product Hunt brought €2,320 of the week's €3,840, which is 58 annual plans. That's real money for a small product, and it answers the question the team argued about before the launch.
The next question is what the launch cost. Billjar spent most of two weeks on preparation, and the €40 price runs for a year. I'd compare the revenue with that time, and keep the discount for the newsletter audience instead of running it again on a general launch.
Get your analytics ready before the day
Work back from launch morning. The day before:
- Install the tracker and send yourself a test visit.
- Set a signup goal and a pricing goal.
- Tag the website link in your listing with
utm_source=producthunt.com. - Add a traffic alert rule, and on launch morning, a launch-day annotation.
On the day, keep the Realtime view and the 404 list open for the first two hours, and look at the signup funnel for Product Hunt visitors by the evening. A week later, check the sources, the bots that were filtered, and the revenue per source.
Clickport does all of this in one dashboard, and it measures your launch visitors without cookies. You can try it free for 30 days, no credit card required, so it's running before launch day. If you're moving from GA4, the switching guide shows how to set it up.
Frequently asked questions
How much traffic does a Product Hunt launch bring?
It depends on your rank, your topic and the time you launch. Most of the traffic arrives on launch day and fades within a few days, while newsletters and social posts can keep sending visitors for a week or more. Measure your own launch rather than relying on someone else's numbers.
How do I track Product Hunt traffic in analytics?
Visits from producthunt.com show up as a source on their own. Tag the website link in your listing with utm_source=producthunt.com, so clicks from the Product Hunt app, which can arrive without a sending page, count as Product Hunt too. Then filter your signup funnel by that source.
Why does Product Hunt traffic show as Direct?
Clicks from apps and some browsers can arrive without the address of the page that sent them. Without a tag on the link, analytics can't tell where those visitors came from, so it counts them as Direct. A utm_source tag on the website link in your listing fixes that.
What should I check after a Product Hunt launch?
Check which sources kept sending visitors in the week after, how Product Hunt visitors moved through your signup funnel compared with your usual traffic, how much bot traffic was filtered, and what the launch brought in revenue.

Comments
Loading comments...
Leave a comment