How Did You Hear About Us? Compare Answers With Analytics
When someone signs up, you get a name and an email. You don't get the podcast they heard, the colleague who sent them, or the ChatGPT answer that named you. One question on the form fills part of that gap.
The useful part comes next: putting each answer beside what your analytics recorded for the same visit. Sometimes the answers show far more than the clicks. Sometimes the clicks show more than people remember. Either way, you learn where to look next.
- A “How did you hear about us?” answer records what a customer remembers. A last-click report records the source of the visit where they converted. Each view misses what the other sees.
- At n8n, Google Analytics credited AI assistants with 0.9% of signups, while n8n's own survey put them at 9% by April 2026, according to its agency Graphite. The size of the gap differs from business to business.
- Offer a small, optional list that includes AI assistants. Shuffle the order and keep “Other” last, because people favor options near the top of a list.
- Send the chosen label with the conversion event. Filtering by one answer then shows the sources, entry pages and campaigns recorded for those same visits.
- The comparison covers the visit where someone answered. It shows you where to look. It does not prove what caused the sale.
Why ask “How did you hear about us?”
Clickport, like any last-click report, credits a conversion to the visit where it happened. It records that visit's referrer or campaign. It can't see a podcast, a recommendation, or an AI answer that the person read without clicking. A single question can capture some of that. The answer has its own errors, so the value comes from reading both views together.
The gap can be large. n8n compared the answers to its signup question with Google Analytics. By April 2026, 9% of signups named an AI assistant in the survey, while Google Analytics' last-click report credited AI with 0.9%. Its agency, Graphite, published the numbers in June. On 28 September 2026, Growth Memo cited the study: "AI can be underattributed by 10x."
Omniscient Digital ran a similar check on its own leads. Of 213 leads who answered, 189 named an AI tool. HubSpot's first-touch source credited 28 of them to AI referrals. The other 161 landed in Organic Search (95), Direct (59) and other sources (7).
Both examples come from agencies that sell AI search services, and both businesses attract people who use AI tools. The gap in your business can be much smaller. It can even point the other way. The Northline example below shows what that looks like.
In the same Growth Memo piece, Kevin Indig suggests that you "combine three signals with different blind spots: an exposure metric, a behavioral signal, and a business outcome." In Clickport, the pages AI assistants request are the closest exposure signal. The visits and the answers are the behavior. Goals and revenue are the outcome. (Recording AI requests needs the server-side connector.)
| View | What it records | What it misses |
|---|---|---|
| Recorded source (last click) | The referrer or campaign of the visit where they converted | Earlier visits on other days, answers read without a click, recommendations |
| The answer | What the customer remembers and picks from your list | Steps they forgot, options you didn't list |
| AI assistant requests | The pages assistants fetched from your site | Who read the answer, and whether they visited |
If AI visits in your reports look smaller than they should, here's why ChatGPT traffic often shows as direct.
Which answers should the question offer?
I'd keep the list to a handful of options and put AI assistants in it now:
- Search engine
- AI assistant (ChatGPT, Claude, Perplexity or another)
- Colleague or friend
- Podcast or YouTube
- Article or newsletter
- Other
Adjust the middle of the list to the channels you use, and keep the labels short. They become the values you filter by later.
Shuffle the order for each visitor and keep "Other" at the bottom. Pew Research Center's survey guidance notes that in self-administered surveys, people "tend to choose items at the top of the list". Shuffling spreads that bias across all options.
Listing an option also makes people pick it more often. In one Pew test, 58% chose "the economy" when it was on the list, and 35% named it when they had to answer in their own words. Your "AI assistant" option is likely to work the same way. That's fine as long as the list stays the same during a comparison. If you change the options, start a new comparison period.
Make the question optional. In one online survey experiment, requiring every answer increased dropout and lowered answer quality. A signup form is the last place to lose people over a marketing question.
Ask where the decision ends: on the signup form, the enquiry form or the order confirmation page. The answer then belongs to the same visit as the conversion. That's what makes the comparison possible.
Send the answer to your analytics
Clickport's form tracking never reads what people type into a field. So the answer needs one line of code when the form is submitted:
<script>
  document.querySelector('#signup-form').addEventListener('submit', function (e) {
    var answer = e.target.elements.heard_about.value;
    clickport.track('Signup', answer ? { heard_about: answer } : null);
  });
</script>
The Signup event is always sent. The answer is attached only when the person picked one, so a skipped question doesn't create an empty "(none)" row. The call is sent in a way that survives the page change after the form submits.
Send the fixed label only. If you add a text box for "Other", keep what people type in your own records and send just "Other" to analytics. Free-text boxes collect names and email addresses sooner or later, and they don't belong in your analytics.
The answers appear in Goals → Properties as soon as the first one arrives, with visitors and events for each label. There's nothing to configure. If you also want Signup in your goals list with a conversion rate, create a custom event goal named Signup. The custom properties guide covers the limits.
Pulling the comparison through the API
The same comparison works through the Stats API. Filter by the answer and ask for sources:
POST /api/query
{ "metrics": ["visitors"], "dimensions": ["source"],
  "filters": [{ "dimension": "prop:heard_about", "operator": "is", "value": "AI assistant" }],
  "period": "30d" }
Or filter by a source and ask for the answers with "dimensions": ["prop:heard_about"]. A property can't be combined with a second dimension in one call, so run one request per answer.
Relay: they said AI assistant, the visit said Direct
Relay, Fieldwork Advice and Northline Goods are made-up businesses. Their numbers show the patterns this comparison can reveal.
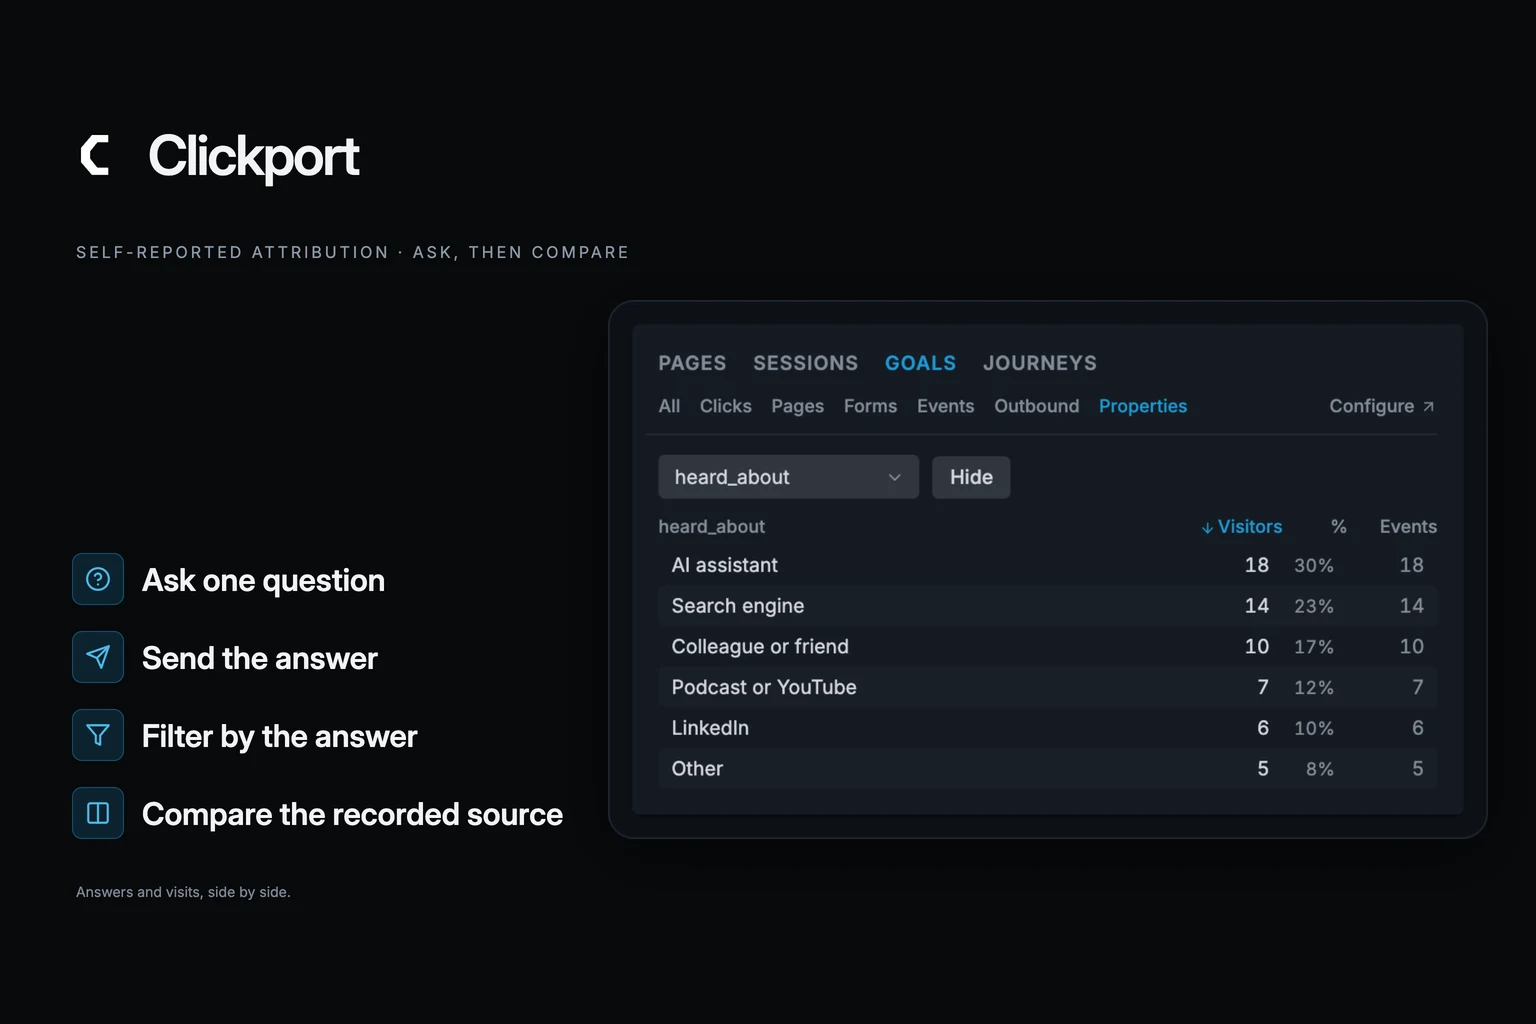
Relay asks the question on its signup form. Over 30 days, 60 people answered. Eighteen picked AI assistant, 14 a search engine, ten a colleague or friend, seven a podcast or YouTube, six LinkedIn and five Other.
Clicking AI assistant in the Properties list filters the whole dashboard to those 18 signup visits. Sources then shows what the browser recorded: ten visits arrived as Direct, six came from ChatGPT and two from Google.
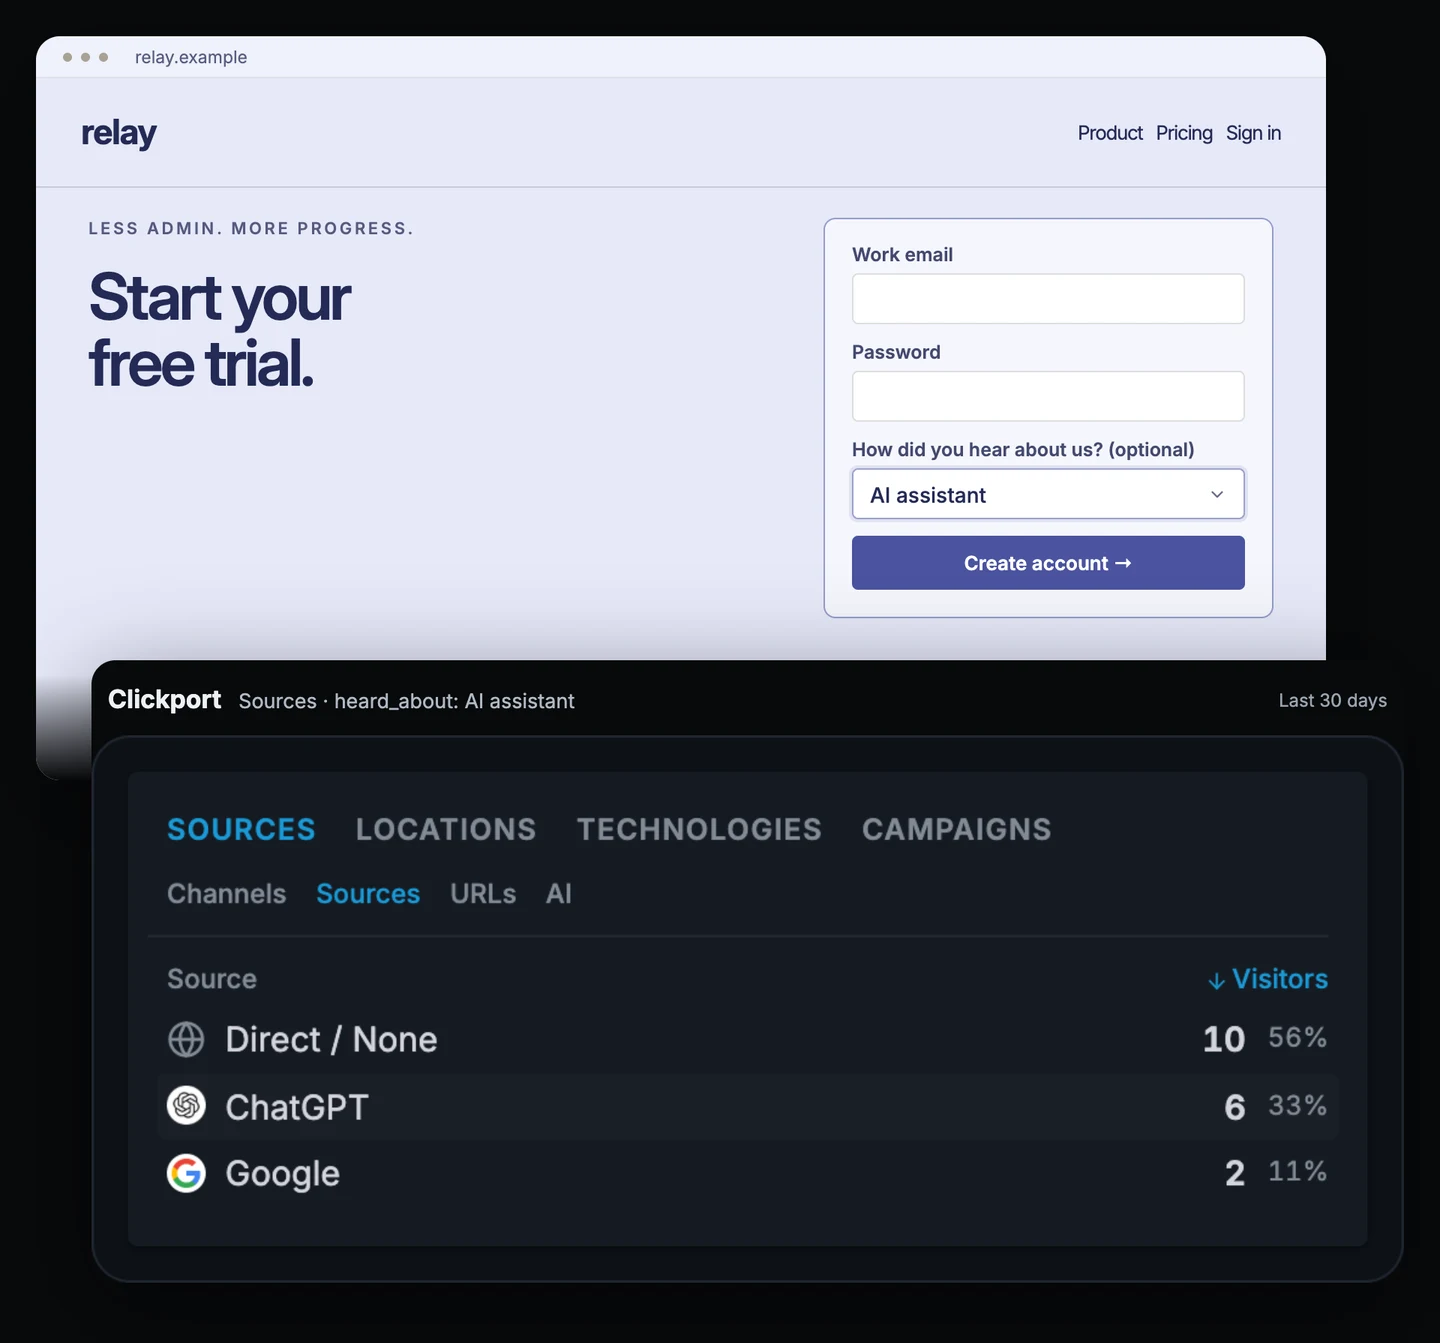
A third of the people who credit an AI assistant arrived with a ChatGPT referral. The other twelve typed the address, used a bookmark or came through Google. Some of the Direct visits may also be clicks from the ChatGPT app that lost their referrer. The Direct row is the part the click data can't explain on its own.
I'd do three things with this. First, open Pages → Entry under the same filter. If most of those visits started on pricing, the AI answers may describe Relay well enough to send people straight there. Second, check which pages AI assistants request in Pages → AI, and read them. Third, add the answer to the monthly report next to the AI Search channel, so the two numbers are read together. This guide to AI leads and sales shows how to report the channel itself.
Eighteen answers in one month show a direction. I'd run the same comparison for another month before moving any budget.
Fieldwork Advice: a colleague's tip arrives as a LinkedIn visit
Fieldwork Advice asks the question on its enquiry form. The adviser has a different puzzle: LinkedIn sends a steady trickle of enquiries. Are the posts working, or is something else going on?
This time the comparison runs in reverse. Clicking LinkedIn in Sources filters to those visits. Over 90 days, 12 of those enquiries included an answer, and Goals → Properties shows them. Seven named a colleague or friend, three said LinkedIn and two an article or newsletter.
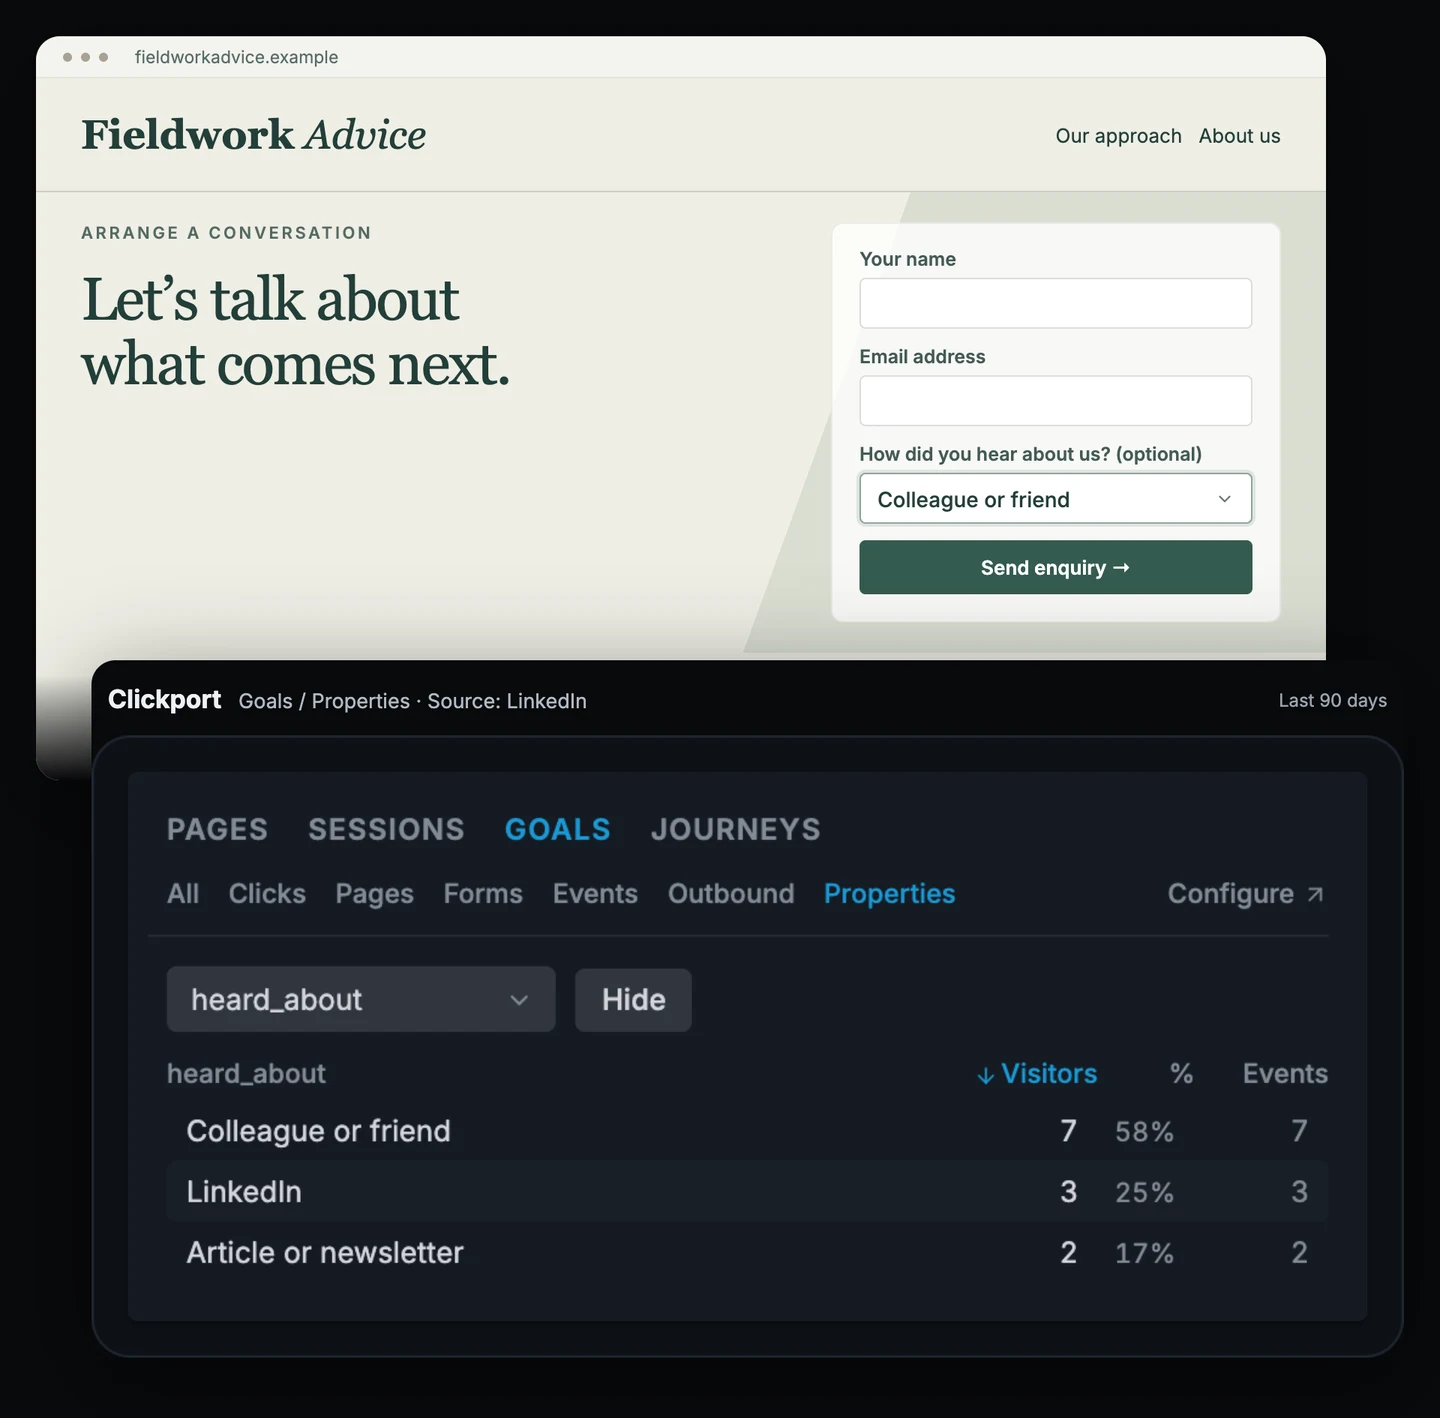
Most people who arrived from LinkedIn remember a person. That fits how advice travels. A client shares an article with a colleague, and the colleague clicks it. The recorded source and the answer are both correct. They describe two steps of the same recommendation.
For Fieldwork, that changes what a good post looks like. A guide a client wants to forward, such as a checklist for a retirement review, is worth more than a post written for likes. I'd keep publishing those and treat LinkedIn in the report as partly word of mouth.
Twelve answers in 90 days is a small group. One or two more answers would change the split, so I'd check the pattern again next quarter before quoting a percentage.
Northline Goods: “Google” can mean many things
Northline asks one question on its order confirmation page, with an older list: Google, Instagram, a friend, Other. In the last 30 days, 40 buyers picked Google.
Filtered to those 40 buying visits, Sources shows 16 visits from Google, 11 Direct, nine from Instagram and four from ChatGPT.
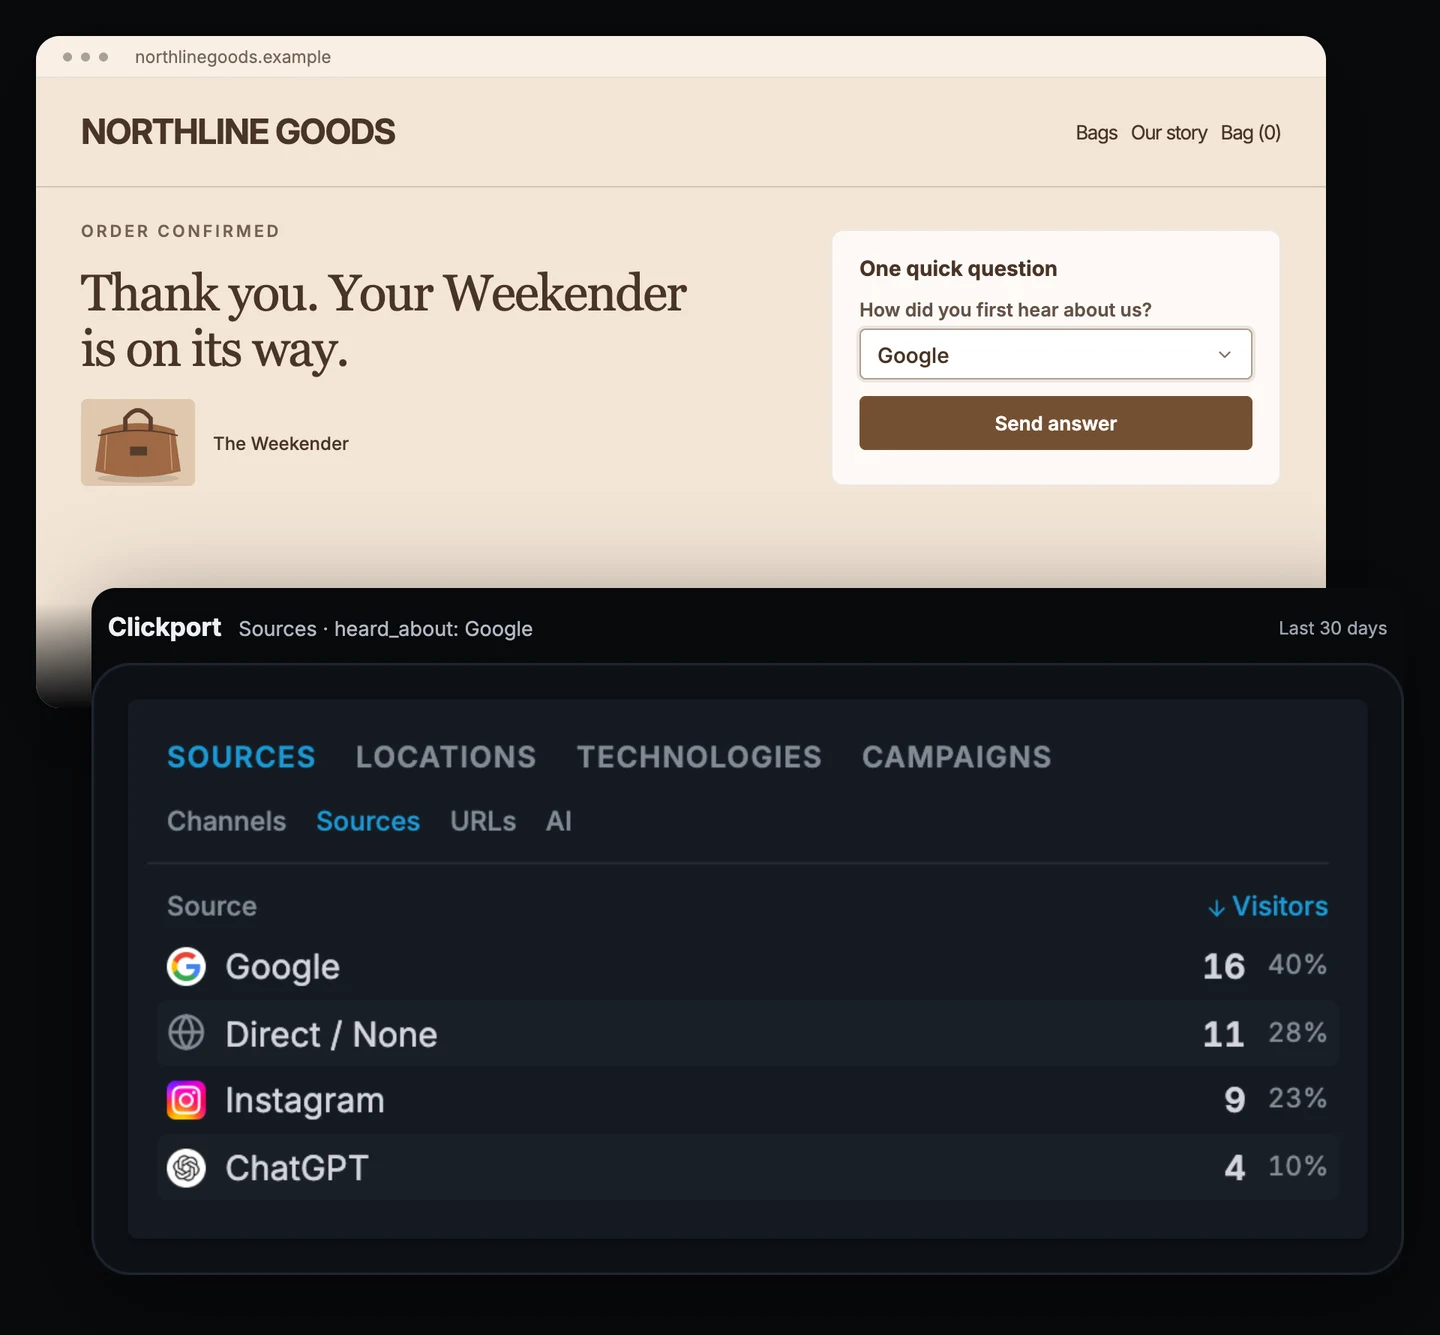
Here the click data shows more than the answers. Nine people remembered Google, yet their buying visit came from Instagram. Four more came from ChatGPT, and the list had no AI option for them to pick. A likely reason for the Google answers: people remember a step they took themselves, such as searching for the brand, better than an ad they scrolled past. "Google" is also the answer people give when nothing more specific comes to mind.
For Northline, the next step is a better list. I'd split the option into "Search engine" and "An ad", add "AI assistant", and read Instagram's role from the campaign data.
The question sits on the confirmation page, so the Clickport tracker has to run on that page. Hosted checkouts limit which scripts can run there. On Shopify, for example, checkout pages need a separate Custom Pixel, as our Shopify guide explains, and that pixel doesn't send a custom answer. Check with your developer that the answer can be sent before you add the question.
How far can you trust the answers?
People forget. They pick the first option that fits, or the most familiar name. The comparison also covers only the visit where they answered. Clickport's visitor identifiers change every day, so a ChatGPT visit on Monday and a signup on Wednesday can't be linked.
None of this proves what caused a sale. Growth Memo puts it plainly: "triangulation strengthens the evidence, but cannot establish causality on its own." What the comparison gives you is a place to look. When the answer and the recorded source agree, you can be more confident in both. When they disagree, you know which pages, campaigns or answer options to check.
For the wider picture of models and their blind spots, see attribution modeling explained.
Ask, then compare
I'd start with one form. Add the question with a small list, send the chosen label with the conversion event, and leave it for 30 days. Then click each answer and look at the sources and entry pages behind it.
Clickport keeps both views in one dashboard: the answers in Goals → Properties, and the recorded sources, entry pages and campaigns for the visits behind each answer. If your current tool already puts the two side by side, you don't need to switch for this.
If it doesn't, try Clickport with that one question. If you're moving from Google Analytics, the switching guide covers the setup.

Comments
Loading comments...
Leave a comment