SEO Reporting When Traffic Is Down: Three Numbers to Show
Your Google visits are lower than last year, and the next budget meeting is close. Someone will open the traffic chart and ask whether search still earns its money.
Traffic is the wrong number to defend. In the first four months of 2026, 68% of US Google searches ended without a click, according to SparkToro's analysis of Similarweb data. A plan that counts only visits shrinks before the year starts, even when the work goes well.
Good SEO reporting when traffic is down shows three numbers side by side: how often Google showed you, how many people searched for your name, and how many visitors became customers. Below I explain where to find them and what each mix means, with four example businesses. The businesses are made up. The dashboard panels are real Clickport reports, filled with the example numbers.
- Google visits alone can't show whether your search work still pays off.
- Report three numbers together: Google impressions, brand searches and conversions.
- Every combination of the three numbers calls for its own first fix.
- Compare Search Console impressions only for dates after 27 April 2026.
- In Clickport, filter Google visits to your home page to see brand searches.
Which three numbers belong in SEO reporting when traffic is down?
Kevin Indig made this case in the Growth Memo on 5 October, with a measurement list from SparkToro's Amanda Natividad. The memo suggests reporting three layers together every month: exposure, behavior and a business outcome. None of them proves much alone. Read together, they give a much clearer picture of whether people find you and buy.
Their exposure layer mixes AI visibility, citations, brand mentions and platform impressions. I'd start with the numbers every site already has:
| Layer | Number to report | Where you find it |
|---|---|---|
| Exposure | Google impressions | Search Console, Performance report |
| Behavior | Clicks on searches for your brand name | Search Console's branded filter, or Clickport (below) |
| Outcome | Trials, enquiries, test rides, orders | Goals and revenue in your analytics |
How do you see brand searches?
Brand searches deserve the most attention right now. Similarweb followed US desktop users after ChatGPT recommended a brand to them. They were 2.5 times more likely to visit that brand within seven days, and over half of those visits started with a search for the brand. A recommendation you'll never see in a report often shows up as someone typing your name into Google.
Search Console has had a branded queries filter for all eligible sites since 11 March 2026. It works on top-level properties with enough impressions, and an AI-assisted system decides which queries count as branded, so a few can be misclassified. If your property has it, use it for the brand total.
In Clickport, connect Search Console, filter the source to Google and the page to your home page. The GSC tab then lists only the searches that brought people to your home page. For most businesses, that list is mostly the brand name and its misspellings, and it sits in the same dashboard as visits, goals and revenue for the same dates. Some people search for a product name and land on a product page, so the count runs a little low.
Three limits apply to every example below:
- Impressions before 27 April 2026. Google's data anomalies page says a logging error kept impressions from being reported accurately from 13 May 2025 to 27 April 2026. Compare impressions only across dates after that. Clicks and conversions can still be compared with the same month last year.
- Delay. Search Console data arrives one to three days late.
- AI answers. Google counts clicks from AI Overviews and AI Mode inside the "Web" search type of the Performance report. You can't separate them.
The Growth Memo pairs each mix with its own fix. The four rows adapt its examples to Google numbers:
| What you see | Usually means | First fix |
|---|---|---|
| Impressions up, brand searches flat | People see your content and forget the name | Distribution |
| Brand searches up, conversions flat | People look for you and don't buy | The page they land on |
| Brand searches and direct visits both up | Something outside Google works | Find the source, do more of it |
| Impressions and brand searches both down | Someone else takes your place | Look at who ranks and gets recommended now |
Every example compares September with June. Both months fall after the logging error, so their impressions are safe to compare.
Paysheaf: Google shows the guides, but nobody remembers the name
Paysheaf sells payroll software to small firms. Its guides on holiday pay and overtime now appear in AI Overviews, and the quarterly numbers look like they contradict each other.
Google impressions rose from 236,000 in June to 412,000 in September, up 75%. Google visitors fell 18%, from 11,900 to 9,800. Clicks on searches for Paysheaf barely moved, from 1,210 to 1,240, and trials started went from 190 to 186.
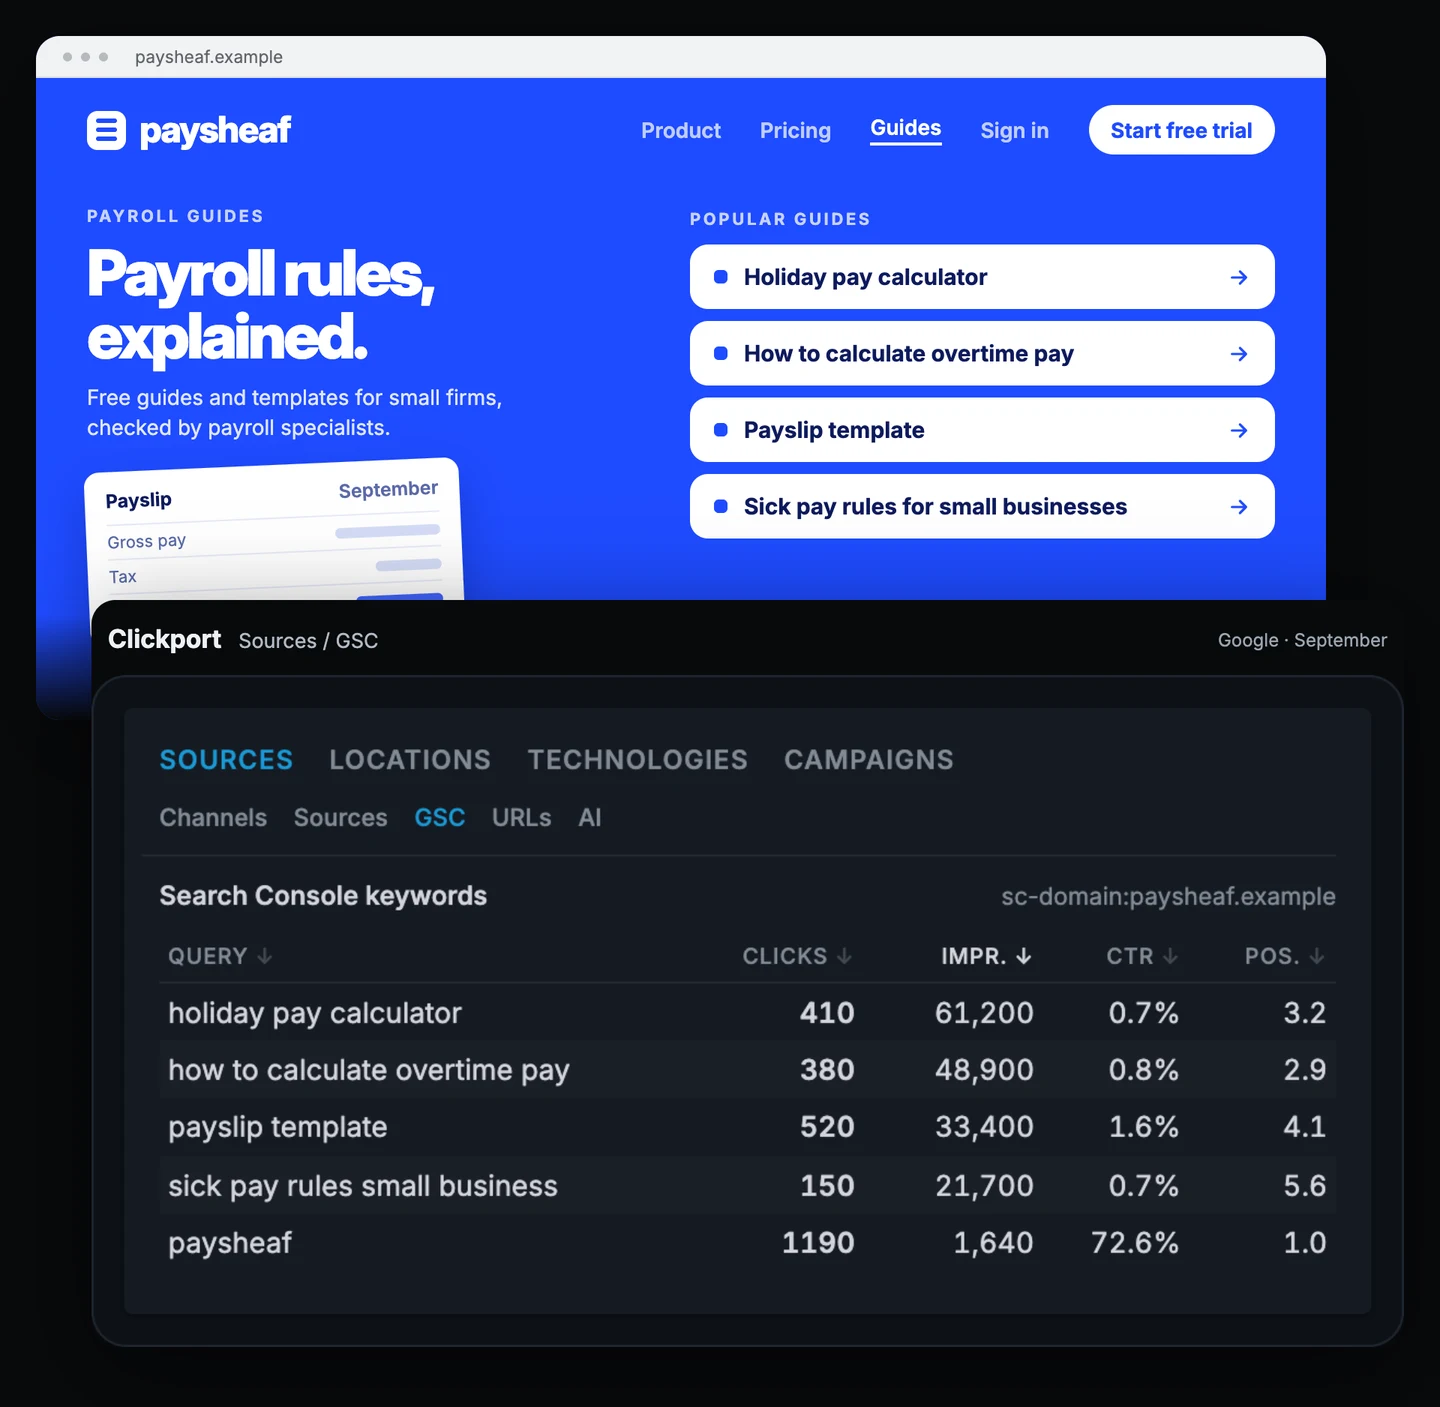
| Search | Clicks | Impressions | Position |
|---|---|---|---|
| holiday pay calculator | 410 | 61,200 | 3.2 |
| how to calculate overtime pay | 380 | 48,900 | 2.9 |
| payslip template | 520 | 33,400 | 4.1 |
| sick pay rules small business | 150 | 21,700 | 5.6 |
| paysheaf | 1,190 | 1,640 | 1.0 |
Paysheaf's Search Console keywords for Google in September, as in the figure.
The search "holiday pay calculator" showed Paysheaf 61,200 times and sent 410 clicks. People got their answer on Google. That reach is real, and the brand clicks show what it didn't do: hardly anyone came back later to look for Paysheaf by name. The "paysheaf" row holds 1,190 of September's 1,240 brand clicks, and searches such as "paysheaf login" bring the rest.
I'd treat this as a distribution problem. The guides already do their job on Google, so the work moves to the name:
- Put Paysheaf inside the answer. A figure from Paysheaf's own payroll data, or a calculator people cite by name, gives a summary something to credit.
- Take the guides where payroll people talk. Accounting forums, newsletters, partner sites, review sites and comparison articles all carry the name. In an AirOps study of B2B software questions, 85% of brand mentions in AI answers cited another website as the source, and 13% the brand's own site. Nearly 90% of the mentions on other websites came from lists, comparisons and reviews.
If you want to see how much of the rise comes from AI answers, Search Console's generative AI report shows those impressions separately. It shows no clicks.
Impressions show reach. They don't show that anyone remembers you. I wouldn't report a 75% rise as success until brand searches follow, for the same reason I call AI visibility scores vanity metrics.
Hillvolt Bikes: more people search for the name, but test rides stay flat
On 14 July, a cycling YouTuber reviewed Hillvolt's Trail 2. Clicks on searches for Hillvolt went from 1,050 in June to 2,480 in September, up 136%. Google visitors who landed on the home page more than doubled, from 1,800 to 3,900. Test rides booked by those home page visitors went from 39 to 41.
People came looking. They didn't find what they came for.
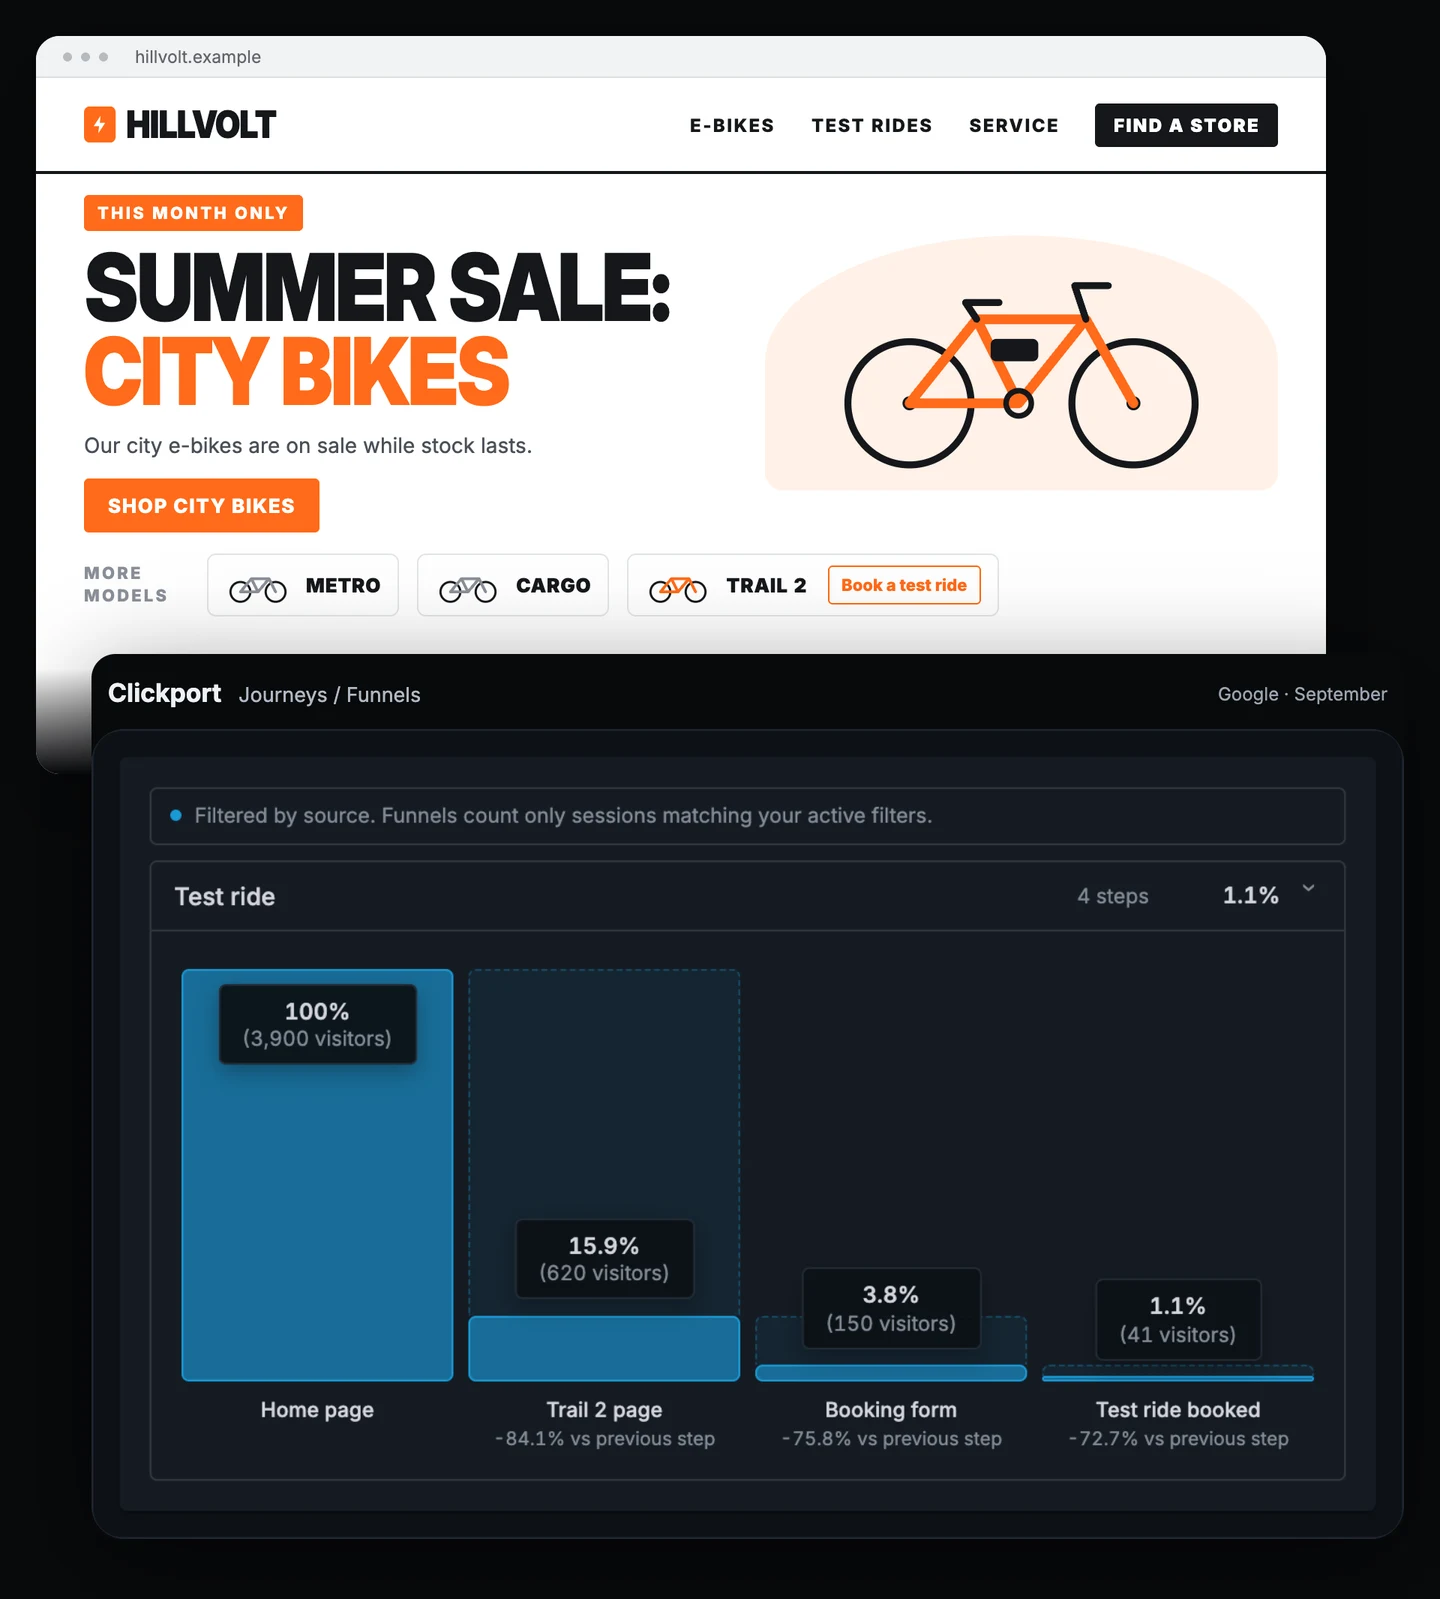
The home page still leads with a summer sale on city bikes. The Trail 2 sits in a small row further down. Of 3,900 home page visitors from Google, 620 reached the Trail 2 page, 150 reached the booking form and 41 booked a test ride. The biggest loss is the first step: 84% never reached the bike from the review.
I'd change the home page before paying for more reach. Put the Trail 2 at the top, quote one line from the review, and place "Book a test ride" next to it. Then check the funnel again after four weeks.
The pattern matches a large study of online shops. In SISTRIX and LEAP's study of large German online shops, 69.7% of research searches showed an AI Overview, and 0.2% of purchase searches did (in German). Purchase searches still get the classic results with links, and Hillvolt's brand clicks show that people close to buying still arrive.
One limit matters here. "Test ride booked" is a goal for a submitted booking form. It counts bookings, and some booked rides won't happen.
Bramwick Coffee: brand searches and direct visits rose together
Bramwick sells coffee subscriptions. On 9 September, its founder spoke on a coffee podcast. September then differed from June in three numbers at once. Direct visitors went from 1,700 to 3,100, up 82%. Clicks on searches for Bramwick went from 690 to 1,320, up 91%. Subscriptions started went from 118 to 212. Clicks from all other Google searches stayed flat, at about 2,000.
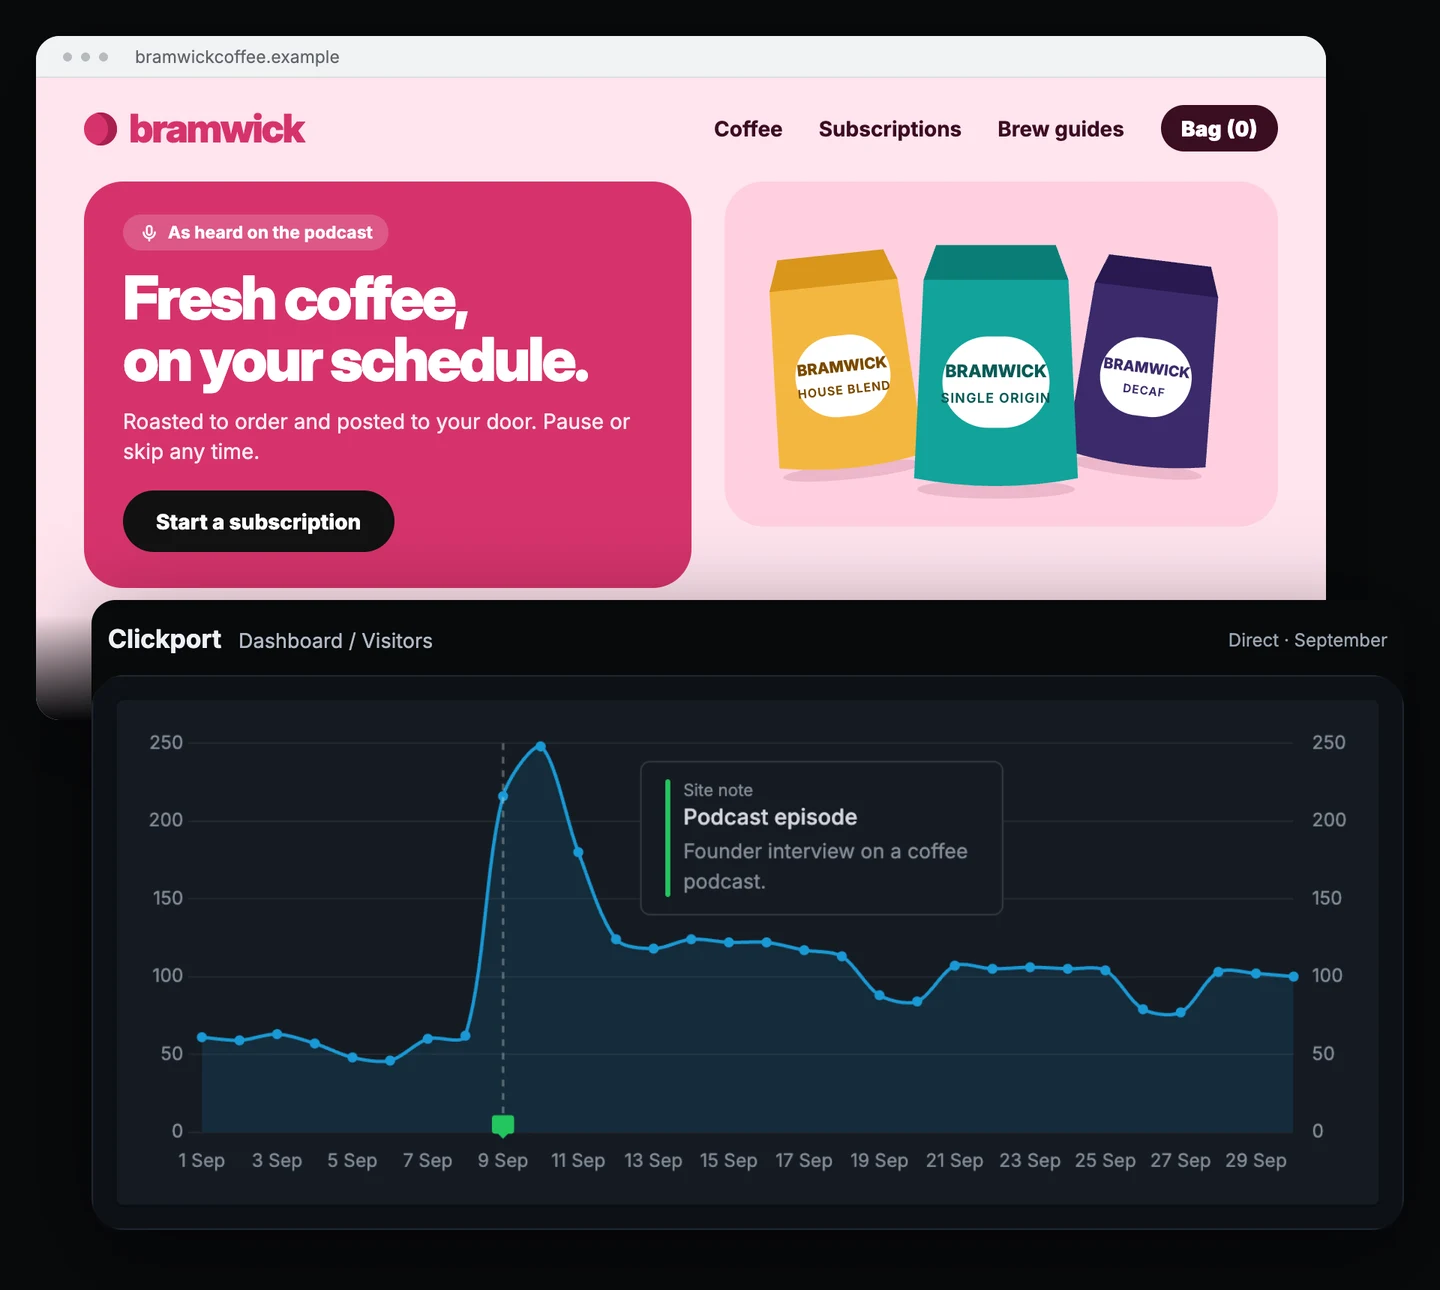
Direct visitors ran at about 60 a day before the episode, reached 248 on 10 September and then settled near 100 a day.
When brand searches and direct visits rise together and other searches stay flat, something outside Google is working. It's often a podcast, an event, a partner or a colleague's tip. Search and direct visits only show the echo.
Here, the timing points to the podcast. Timing alone is weak evidence, so Bramwick asks one question at checkout: "How did you hear about us?" In September, 151 of the 212 new subscribers answered it, and 64 of them chose Podcast. The answer is stored as a custom property, so it sits next to the visit data. I explained that setup in How Did You Hear About Us? Compare Answers With Analytics.
I'd find the source and fund more of it: another episode, the same host, or a code for listeners. I'd also say clearly in the report where the rise came from. The search team didn't create it, and the brand searches made it visible.
Direct visits also include bookmarks, email apps and other sources. The answers to the question are the stronger evidence for the podcast.
Solvard Solar: what the agency tells the client
An agency runs search for Solvard, a solar installer in one region. From June to September, impressions fell from 81,000 to 58,000, down 28%. Clicks on searches for Solvard fell from 470 to 316, down 33%. Quote requests went from 35 to 22.
Solar is seasonal, so June against September could mislead. The agency also checks clicks against last September, which is safe because the logging error affected impressions only. Solvard's brand clicks were 455 last September, so they're down 31% on the year as well.
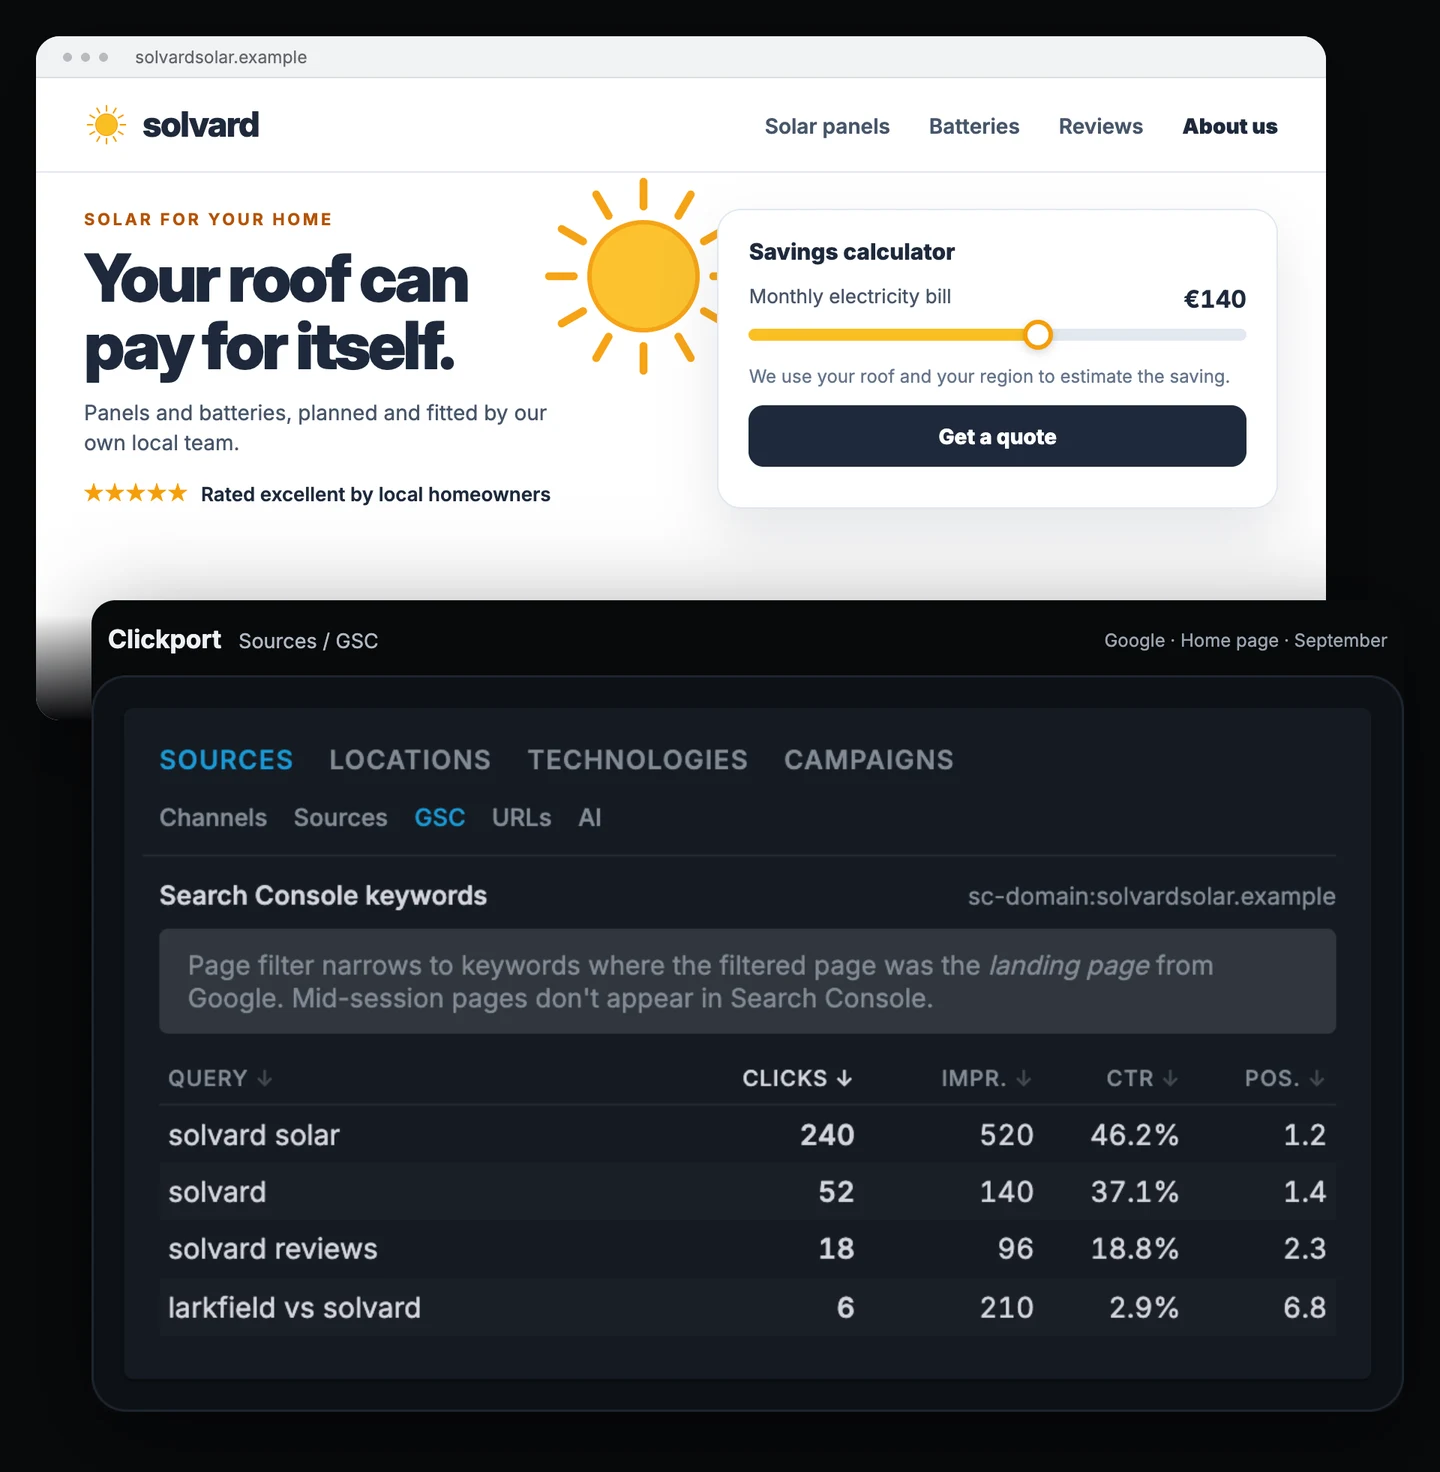
| Search | Clicks | Impressions | Position |
|---|---|---|---|
| solvard solar | 240 | 520 | 1.2 |
| solvard | 52 | 140 | 1.4 |
| solvard reviews | 18 | 96 | 2.3 |
| larkfield vs solvard | 6 | 210 | 6.8 |
Solvard's Search Console keywords for Google visits to the home page in September, as in the figure.
The list shows what changed. "solvard solar" still brings most of the clicks, 240 of them. A new query appears below it: "larkfield vs solvard", shown 210 times and clicked 6 times. Larkfield Solar, a competitor, now ranks with comparison pages, and searchers meet Solvard inside Larkfield's story.
When impressions and brand searches fall together, I'd look at who took the place. Search the main category terms, note who ranks and which names AI answers mention, and read Larkfield's comparison page the way a buyer would. Then decide whether Solvard needs its own comparison page, more reviews or stronger local pages.
The agency's monthly note can then be short:
September search report for Solvard Solar
What happened: Google showed Solvard 28% less than in June. Clicks on searches for the Solvard name fell by a third, and quote requests went from 35 to 22. Brand clicks are also 31% below last September, so the season doesn't explain the fall.
Why: a competitor, Larkfield Solar, now ranks with comparison pages. Searchers now meet Solvard through "larkfield vs solvard".
What we recommend: a Solvard comparison page and a review drive in October. We'll report the same three numbers in November.
That's the shape clients ask for. One person who receives these reports wrote on Reddit: "Just tell what happened, why, and then what you'd recommend we do about it."
Start with one month of brand searches
Work back from the meeting. Before you change any target, write down three numbers for last month: Google impressions, brand clicks and conversions. Do the same for an earlier month after 27 April 2026, and for the same month last year for clicks and conversions. Then find your row in the table above.
In Clickport, that's one dashboard. Connect Search Console, filter the source to Google and the page to your home page, and read the GSC tab next to your goals. If Search Console's own branded filter is available for your site, use it for the brand total, and use Clickport to see what Google visitors on your home page did next. If your current tools already give you all three numbers for the same dates, keep them.
You can try Clickport free for 30 days, no credit card required. If you're moving from GA4, the switching guide shows how to set it up. If your traffic fell and you want to know what the drop cost, Google Traffic Dropped: What Did It Cost Your Business? walks through that check.
Frequently asked questions
Is SEO still worth it?
For most businesses, yes, but the return shows up in more places than visits. SparkToro counts 232 clicks to the open web for every 1,000 US Google searches. Searches close to a purchase still get classic results, and people often search for a brand by name after ChatGPT recommends it. Judge SEO by brand searches and conversions next to visits.
How do I see branded search traffic?
Use Search Console's branded queries filter if your property has it. In Clickport, filter the source to Google and the page to your home page, then open the GSC tab. That list shows the searches that brought people to the home page, which are mostly brand searches.
Does Search Console count clicks from AI Overviews?
Yes. Google counts clicks and impressions from AI Overviews and AI Mode inside the "Web" search type. You can't split out the clicks. The generative AI report in Search Console shows the impressions from those features on their own, with no clicks.

Comments
Loading comments...
Leave a comment