Black Friday Analytics Checklist: Get Ready for Peak Traffic
Black Friday is on 27 November this year. Last year it was on 28 November. That one-day shift is enough to spoil a year-over-year comparison, and GA4 has removed the date option that handled it. Its “Previous year” comparison keeps the calendar date, so this Black Friday lands next to last year's Thanksgiving.
The comparison is one item on the Black Friday analytics checklist I'd finish in October. The others are a baseline from normal weeks, a test of the action that pays you, and a plan for who reads which report while the day is happening. What each job looks like depends on the business. A shop, an affiliate site, an agency and a SaaS company check different things, so after the shared checks I'll go through one example of each.
- Black Friday is on 27 November 2026 and was on 28 November 2025. Compare it with last year's Black Friday on a matching weekday. The same calendar date last year was Thanksgiving.
- Write down a normal week before the peak. Without a baseline from ordinary weeks, any sale day looks like a success.
- Test the action that pays you on a phone in October: a purchase, an affiliate click, a booking or a paid plan. Mobile devices accounted for 57.5% of US online sales on Cyber Monday 2025, according to Adobe.
- Each business checks something different. A shop checks the mobile checkout, an affiliate site checks its product links, an agency sets one plan and alerts for every client, and a SaaS company checks revenue by channel.
- The same checklist works for every peak with more traffic than usual: the October sales, Christmas, a launch or a press mention.
What should you check before Black Friday?
Check five things before Black Friday: a baseline from normal weeks, last year's numbers for the same weekday, the action that pays you, your campaign links and pages, and who reads which report on the day. Start in October, while there's time to fix what you find.
The days themselves are short. In PwC's 2026 holiday survey, about 40% of all planned gift spending by US shoppers falls in the five days from Thanksgiving to Cyber Monday. A goal that stops counting on Friday morning stays wrong in every report you make in December.
Here's the order I'd work in:
By the end of October
- Write down a normal week. Pick two or three ordinary weeks and note visitors, conversions and revenue for each channel. Compared with nothing, a sale day always looks good. Compared with a normal Friday, you can see what the sale added.
- Collect last year's numbers. Note last year's Black Friday weekend from your current analytics tool and from the store or payment records. If you change tools this year, write them down before you lose access to the old account.
By mid-November
- Test the action that pays you, on a phone. Buy something, click an affiliate link, send an enquiry or start a trial yourself. Then check that it arrives in the realtime view or as a goal match.
- Check the links your campaigns will use. Every email and ad should carry the same UTM tags, spelled the same way. Look for broken pages too: last year's sale pages and sold-out products are easy to forget.
- Decide who reads what, and when. Set an alert for when a campaign starts working and one for when traffic stops. Agree who opens the dashboard when one arrives.
After the peak
- Compare, reconcile and add a note. Compare the day with a matching weekday, check the revenue against the store's records, and add a note to the chart so next year's comparison has context.
One limit applies to every business below. Analytics records visits and the actions people take. The store, the payment provider or the affiliate program keeps the money. Use analytics to see where the money came from, and the store's records to say how much it was.
How do you compare Black Friday with last year?
Compare Black Friday with last year's Black Friday on the same weekday. Black Friday is the Friday after US Thanksgiving, so the date moves every year. A comparison that keeps the calendar date puts this year's sale next to last year's Thanksgiving.
Google's help page says the “Previous year (match day of week)” option has been removed from GA4. The remaining “Previous year” keeps the date. Here's where each setting lands for Black Friday 2026:
| Comparison setting | Friday 27 November 2026 is compared with |
|---|---|
| GA4 “Previous year” | Thursday 27 November 2025, Thanksgiving Day |
| Clickport “Year over year” with “Match day of week” | Friday 28 November 2025, Black Friday |
| Clickport “Smart baseline” (the default) | The average of the four Fridays before it, 30 October to 20 November 2026 |
In Clickport, open the date picker, choose Customize, pick Year over year and leave Match day of week ticked. The setting stays with the site. On 28 November you can choose Yesterday and see Black Friday next to last year's. A Friday-to-Monday range compares with 28 November to 1 December 2025.
The default, Smart baseline, answers a different question: how much bigger than a normal Friday was today? That's useful on the day itself. For the weekend against the weekend before, choose Previous period with Match day of week.
A year-over-year view needs data from last year. If a site started measuring this year, Clickport shows “Not enough historical data for comparison yet”, and any new tool without last year's data has the same gap. That's why the second check matters. Write last year's numbers down now, while you still have access to them.
Whatever tool you use, check which date the comparison lands on before you send anyone a percentage.
Online shops: test the purchase on a phone
The four businesses in the rest of this article are made up. The checks are the ones I'd run.
Northline Goods sells bags and homeware from its own website. The order confirmation page sits on the same site, so a Pageview goal on that page marks a completed order. Its funnel runs from product page to cart, checkout and confirmation.
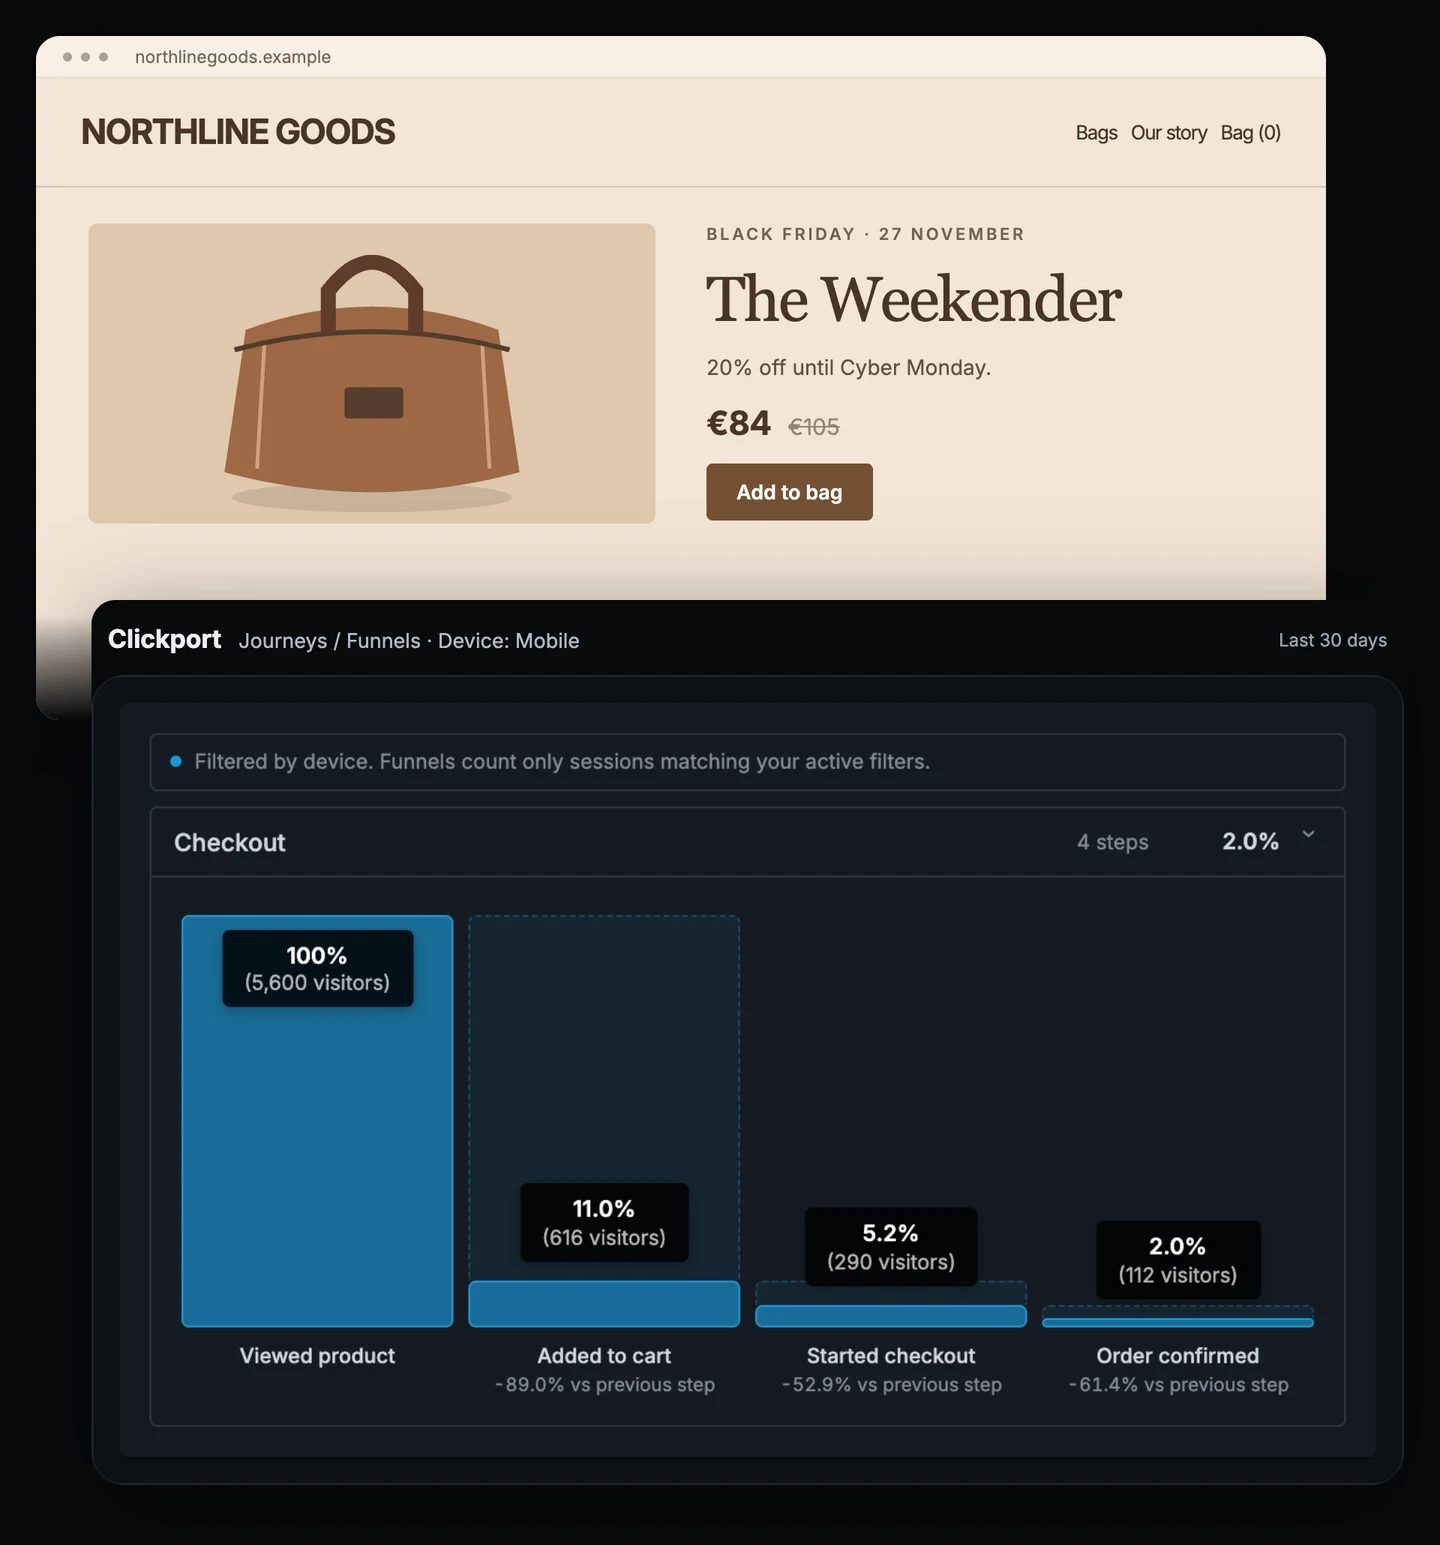
Here are the last 30 days, with the device filter set to Mobile and then to Desktop. The percentages show how many visitors from the previous step got this far:
| Funnel step | Mobile visitors | Desktop visitors |
|---|---|---|
| Viewed product | 5,600 | 2,400 |
| Added to cart | 616 (11.0%) | 312 (13.0%) |
| Started checkout | 290 (47.1%) | 174 (55.8%) |
| Order confirmed | 112 (38.6%) | 121 (69.5%) |
Phone visitors reach the cart almost as often as desktop visitors. The gap is widest at the last step: 38.6% of mobile checkouts finish, against 69.5% on desktop.
I'd test the payment step on a phone before doing anything else. Is the pay button below the fold? Does a discount code box reset the form? Do the wallet buttons load quickly on a mobile connection? Buy something on an iPhone and on an Android phone with the payment methods your customers use, and watch the order arrive in the realtime view. After a fix, compare the mobile funnel again.
This matters more on sale days. Adobe reported that 57.5% of US online sales on Cyber Monday 2025 came through a mobile device.
One limit changes how to read the weekend. A funnel counts visitors who complete the steps within 24 hours. Someone who fills a cart on Friday and pays on Monday shows up as a drop at checkout.
If your shop runs on Shopify, the checkout happens on Shopify's side of the store. The Shopify setup explains how purchases reach Clickport, and the Shop Pay article explains why some of them never reach GA4.
Affiliate sites: find the pages and products that earn clicks
Quiet Desk reviews home-office gear and links to Amazon. Its question for November is simple to ask and hard to answer from an affiliate dashboard: which pages and products deserve attention first?
The affiliate program shows the orders. Unless you create a tracking ID for every page, it doesn't show which review sent the reader. Clickport records each outbound click with the page it came from, and it reads the Amazon product ID from full product links (the ones with /dp/ in the address).
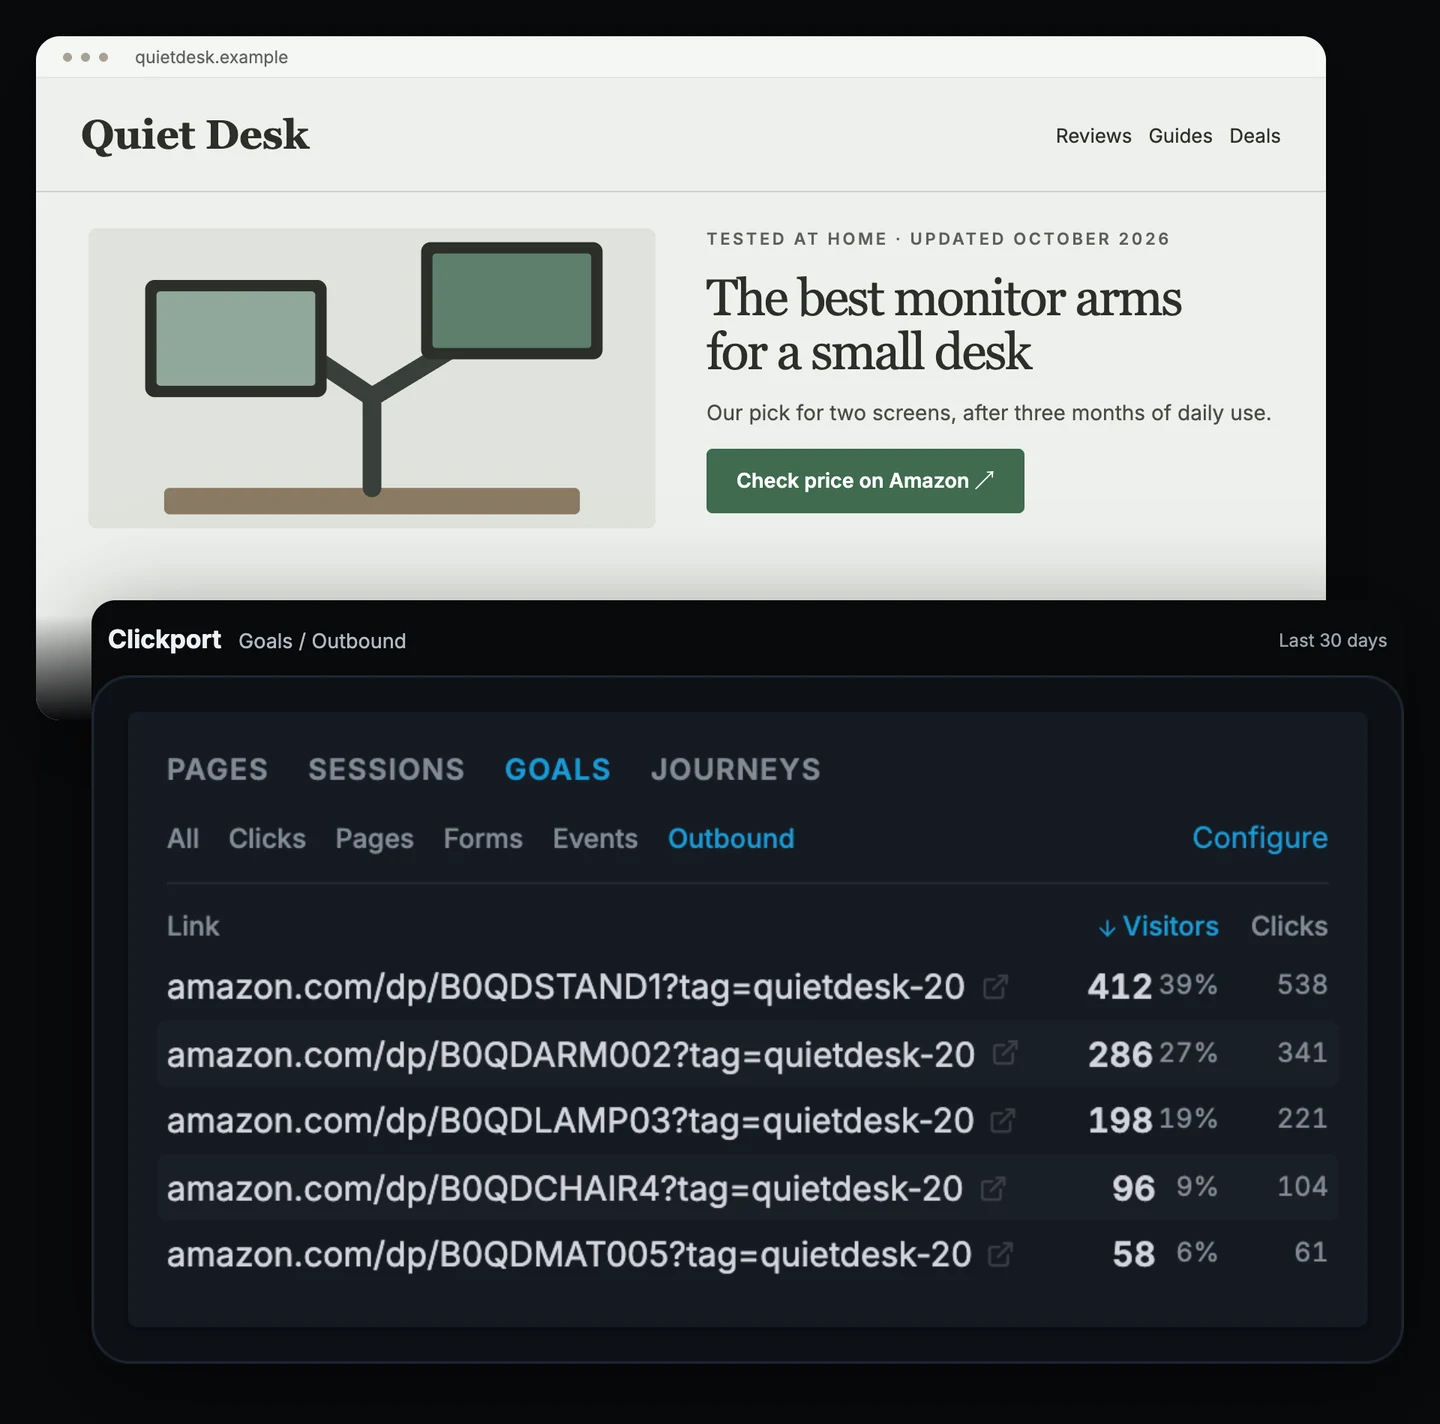
Over the last 30 days, five Amazon links carried the clicks:
| Product link | Visitors | Clicks |
|---|---|---|
| Standing desk | 412 | 538 |
| Monitor arm | 286 | 341 |
| Desk lamp | 198 | 221 |
| Office chair | 96 | 104 |
| Desk mat | 58 | 61 |
The monitor arm now shows “Currently unavailable” on Amazon. In the last month, 286 people clicked through to it.
I'd make a Click goal for that product's ID. Click that goal, and the Pages panel shows the pages those visitors read in the same visit, with a Conversions count for each. The reviews at the top of that list are the ones to fix first: swap the link, or recommend the replacement. Then I'd open the 404 list for old deal pages that still get visits.
The Outbound list also tells Quiet Desk which recommendations to check on a phone before the sales start. Affiliate traffic is worth a lot to retailers at this time of year: Adobe counted 20.4% of US online revenue in the 2025 holiday season in its “affiliates and partners” channel, which includes influencers.
A click isn't a commission. Clickport shows the clicks for each product and the pages behind them, and Amazon's report shows what people bought. Put the two side by side by product. Use full product links if you want clicks grouped by product; a short link shows up as its own row. For the GA4 version of this setup, see tracking outbound links.
Agencies: give every client the same peak plan
Studio Ledger runs websites and campaigns for several clients. One of them, Alder House, is a small hotel with a Black Friday stay package. The agency needs the same answers for every client, prepared the same way, on the weekend when everyone wants them at once.
I'd set up four things for each client in October.
First, the comparison. Save Year over year with Match day of week on each client site. For a client who is new this year, put last year's numbers from the old tool into the shared plan.
Second, one tagging sheet. Every email and ad uses the same source, medium and campaign names. Clickport lowercases the medium but keeps the source and campaign as typed, so “Facebook” and “facebook” become two rows in the report.
Third, alert rules.
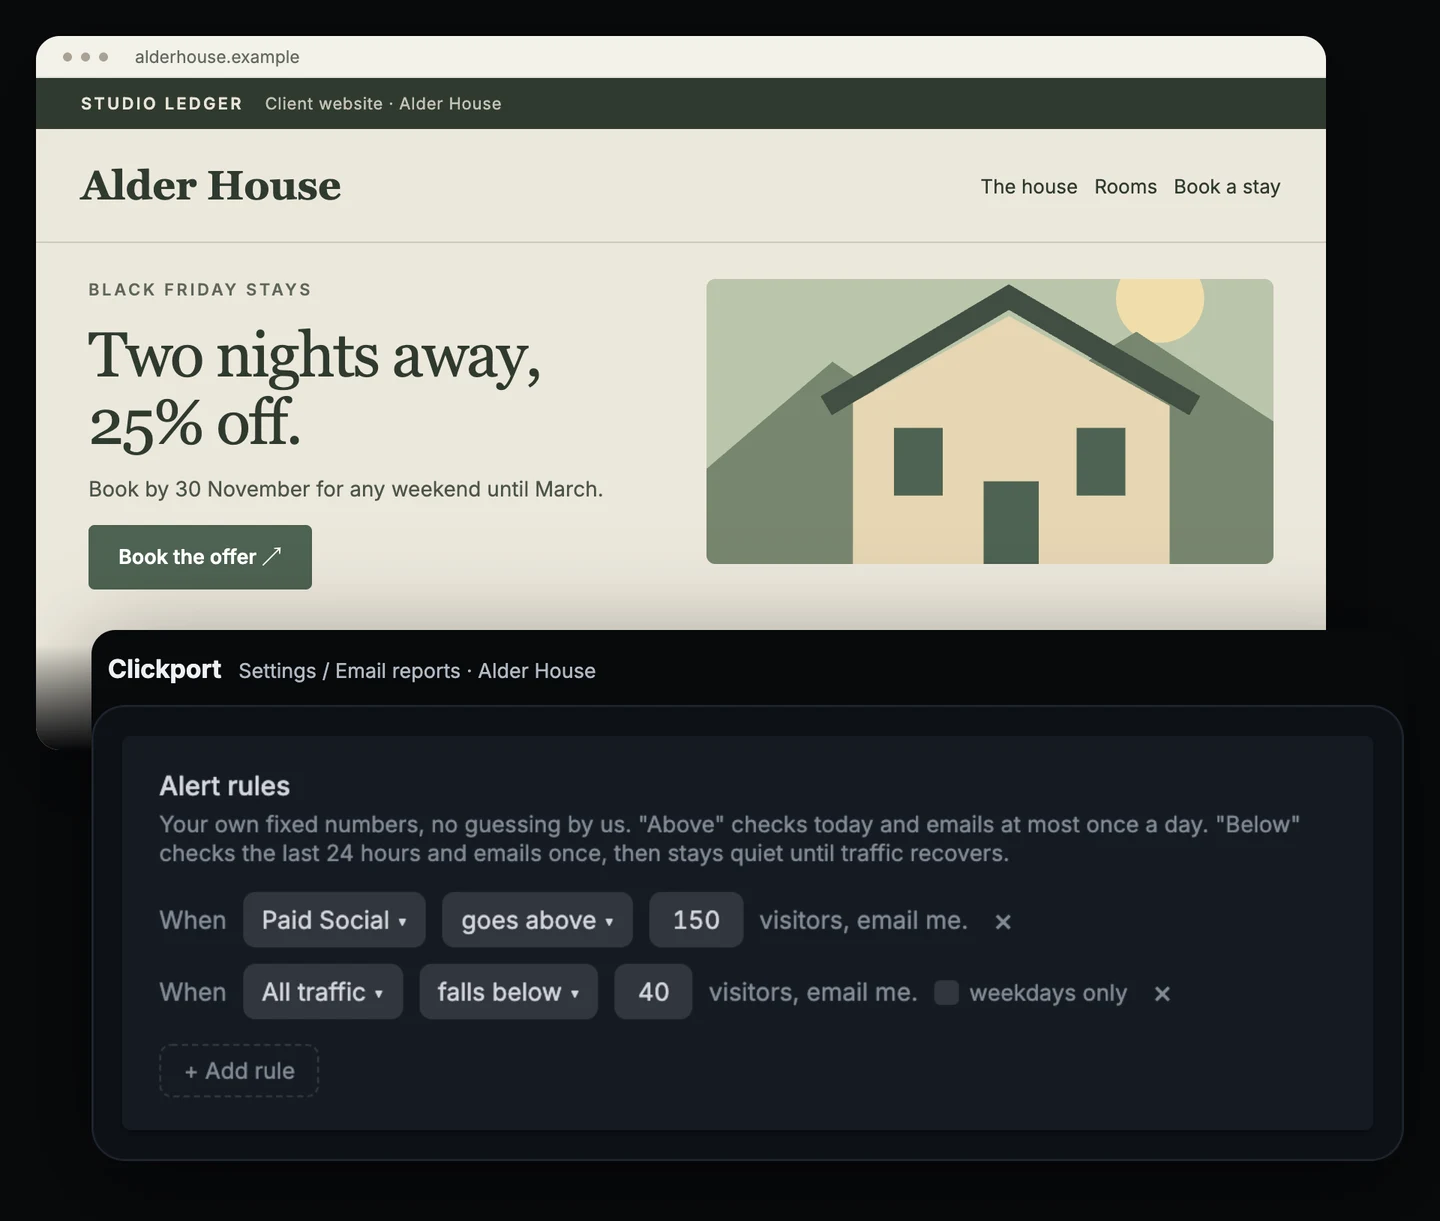
For Alder House, “Paid Social goes above 150 visitors” says the campaign has started to work. “All traffic falls below 40 visitors” is the guard for a broken site or broken tracking. Above rules check today's count, and below rules check the last 24 hours. Each site can have up to five.
Fourth, who reads what. The account lead watches the realtime view when the offer goes live. The client gets a read-only share link and the weekly email report. For a PDF report after the weekend, the 60-second client report covers the setup.
An alert tells you that a number crossed a line. It doesn't tell you why. Name the person who opens the dashboard when one arrives, for each client.
SaaS: count the customers the deal brings
Relay plans a Black Friday deal: its annual Team plan at 25% off, €261 instead of €348. In September it ran a small test promotion with the same offer to see where paying customers came from.
Relay sells through Stripe payment links and has Stripe connected. When a visitor clicks a payment link, the tracker adds a reference to it, so the payment is credited to the channel and source of that visit.
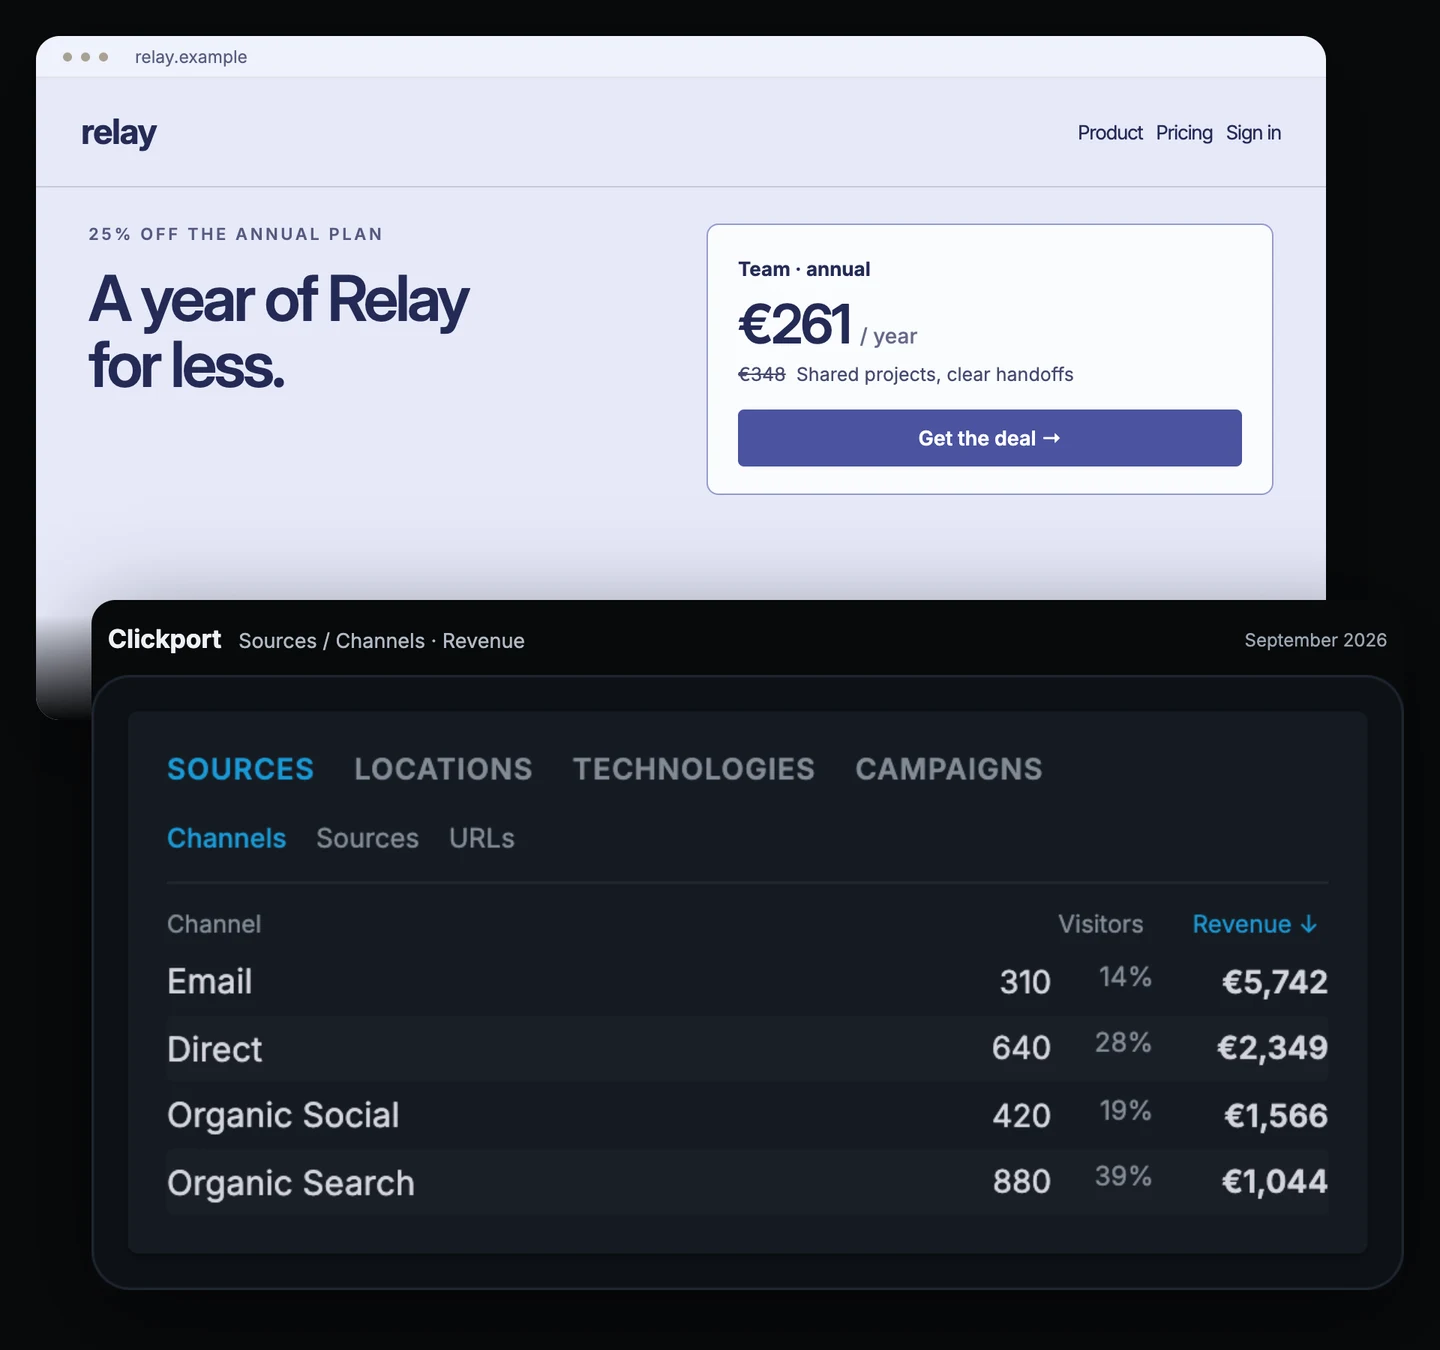
The test brought 41 paid plans worth €10,701:
| Channel | Paid plans | Revenue |
|---|---|---|
| 22 | €5,742 | |
| Direct | 9 | €2,349 |
| Organic Social | 6 | €1,566 |
| Organic Search | 4 | €1,044 |
More than half of the plans came from the email to existing trial users. Email also brought the fewest visitors: 310, against 640 from Direct, 420 from Organic Social and 880 from Organic Search. I'd send the Black Friday offer to trial users and free accounts first, with one campaign tag on every link in that email.
Before November, I'd also buy the deal once through the live payment link and then refund it. The purchase should appear with its source, and the refund should appear as negative revenue on the same visit. If either one is missing, that's the time to find out.
Analytics shows the first payment and where the buyer came from. Whether deal customers renew next November is a question for the billing system. Stripe renewals count in the revenue total, but they aren't credited to a source. If you sell through Paddle, the Paddle setup gives the same source credit with one extra line in the checkout code.
Use the same checklist for every peak
Black Friday weekend is the biggest peak of the year for many shops, but it isn't the only one. Adobe's forecast dates Amazon's October Prime Day event to 6 and 7 October 2026, and expects $9.9 billion in US online spending across all retailers over those two days. Christmas, the January sales, a product launch and a press mention all bring more visitors than usual and a short window to learn from them.
The checks stay the same: a normal-week baseline, the paying action tested on a phone, a comparison on a matching weekday, alerts, and a plan for who reads what. Only the dates change.
I'd run the checklist on the next smaller peak first. If a goal breaks during the October sales, you find out with seven weeks to spare.
Afterwards, add a note to the chart: click the date under the chart and write what happened, such as “Black Friday 2026, 25% off sitewide”. Next year, the comparison comes with its explanation.
Start with one normal week
I'd start this week. Write down one normal week, then test the action that pays you on a phone. The comparison, the tags and the alerts can follow in November.
Clickport covers each check in one dashboard: the weekday-matched comparison, goals and funnels with a device filter, outbound clicks by product, alert rules, and revenue by channel from Stripe or Paddle. If your current tool already does all of this, keep it for the season.
If it doesn't, start a free trial now. A few normal weeks before the peak are the baseline you'll need in December. If you're moving from Google Analytics, the switching guide covers the setup.

Comments
Loading comments...
Leave a comment