I Miss Universal Analytics: What GA4 Took Away and How to Get It Back
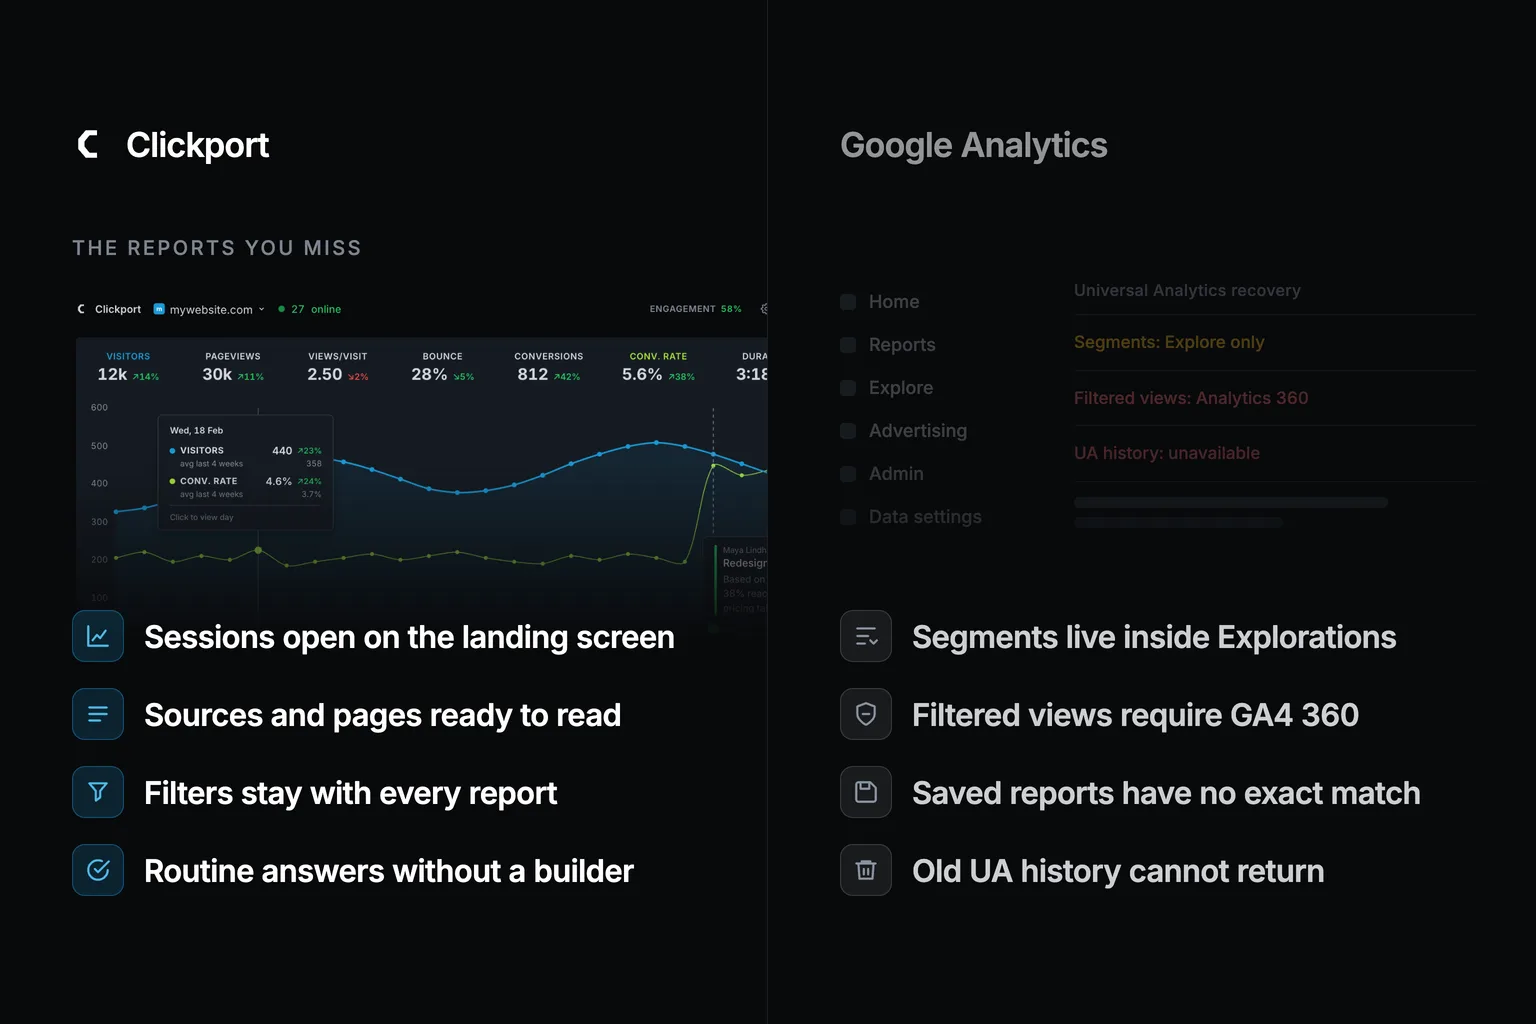
Someone asked a Google Analytics forum what people still find hard about GA4. One answer caught the whole problem in one sentence: it took them five minutes of random clicking to find pageviews for one URL.
That isn't an advanced analysis. It's one page and one number.
I understand the frustration. I used Universal Analytics for years before I built Clickport. Universal Analytics had plenty of faults, but it put familiar reports in familiar places. You could open Audience, Acquisition, or Behavior and get moving.
GA4 changed the model underneath those reports. Google describes it as an event-based system for websites and apps. That gives GA4 capabilities Universal Analytics never had. It also means many old answer paths were renamed, rebuilt, moved into Explorations, or limited to another product tier.
The confusing part is that the story kept changing after GA4 launched. Bounce rate came back. Annotations came back. Sessions never left, but the rules changed. Plenty of articles that still rank today describe an older GA4 than the one you can open now.
So I did two things for this guide. I mapped twelve familiar Universal Analytics workflows against Google's current documentation. I also looked at which reports Clickport customers actually open when they use an analytics dashboard.
The result is less nostalgic than I expected. People don't mainly miss the gray Universal Analytics menu. They miss getting a routine answer without building a report first.
- Across 105 active Clickport customer account-days, the Sessions report was deliberately opened on 85.7% of active account-days. Routine answers still dominate analytics work.
- Six familiar reports produced 53.7% of 1,720 deliberate report switches: Sessions, Channels, Countries, Sources, Campaigns, and Pages.
- Bounce rate and annotations returned to GA4. Bounce rate now uses an engagement definition, and old Universal Analytics annotations did not return.
- GA4 sends old workflows to four places: standard reports, customized reports, Explorations or other products, and paid 360 features.
- Keep GA4 for advertising audiences, cross-device identity, app analytics, predictive audiences, or BigQuery. A simpler dashboard fits routine website questions.
What do people actually miss about Universal Analytics?
Universal Analytics was report-first. GA4 is event-first.
That sounds like a technical distinction, but you feel it every time you ask a basic question. A report-first tool starts with a library of finished answers. An event-first tool starts with flexible data, then asks you to choose dimensions, metrics, scopes, and techniques.
The flexibility is real. GA4 can connect website and app behavior, build advertising audiences, export raw events to BigQuery, and analyze paths across sessions. Universal Analytics was weaker on several of those jobs.
But flexibility adds work to the questions most website owners ask every week:
- How many sessions did we get?
- Which pages grew?
- Where did visitors come from?
- Which campaign worked?
- What changed after the launch?
Those questions explain the attachment to Universal Analytics better than any screenshot of its old menu.
Google didn't simply reskin Universal Analytics. Starting July 1, 2023, standard Universal Analytics properties stopped processing hits. Google says some properties continued briefly while it staged the shutdown.
That matters because you can't recover every old workflow by finding the new name. Some features returned. Some use a new definition. Some moved into a builder. Some still have no free equivalent.
I use four labels throughout this guide: returned, redefined, moved, and still restricted.
How did we measure the reports people still use?
I wanted more than another list of features one analytics founder thinks people need. Clickport records privacy-safe product usage so I can see which dashboard surfaces help and which ones collect dust.
I queried dashboard use through August 31, 2026. The primary sample contains 1,720 deliberate report switches from 11 authenticated, non-admin accounts. Those switches happened across 105 active account-days.
An active account-day means one customer account opened at least one report on one UTC date. This unit stops one frequent user from controlling the ranking just because they clicked the same report 300 times.
I cross-checked the result against Clickport's normalized dashboard pageviews in ClickHouse. That second source contained 9,425 dashboard pageviews across 456 sessions and 80 active dates. Customer domains, property identifiers, and filter values weren't retained or published. Administrator activity was excluded.
There are two important limits.
First, this is Clickport product use. It isn't a survey of every analytics user. Clickport attracts people who prefer simpler analytics, which can strengthen the pattern. The result is directional, not an industry benchmark.
Second, restored or default panels can appear in ClickHouse when the dashboard opens. I use the authenticated activity log for deliberate-selection claims. I use ClickHouse only for session-level cross-checks.
I also tested concentration. One account produced most raw channel-filter and source-filter volume. That makes the dramatic volume percentage unsafe, so I left it out. User reach and account-days give a more honest result.
Which routine reports still matter most?
Sessions was the clear first result. Customers deliberately opened the Sessions report on 90 of 105 active account-days. That is 85.7%. Ten of the eleven measured accounts opened it.
The next five were all familiar summary reports. Channels appeared on 43.8% of active account-days. Countries reached 39.0%, Pages 36.2%, Campaigns 31.4%, and Sources 30.5%.
Those six reports also produced 923 of the 1,720 deliberate report switches. That is 53.7% of all measured report navigation.
This is the part I think most GA4 migration advice misses. People do use goals, funnels, flows, AI traffic, event properties, and detailed technology reports. But more than half of deliberate navigation still went to six routine answers that existed long before GA4.
Filters matter too. The ClickHouse cross-check found a normalized filter path in 175 of 456 dashboard sessions. That is 38.4% of sessions.
I won't pretend every filter was a sophisticated segment. Many were exactly what you'd expect: show me this channel, this source, this page, or this country. Channel filters had the broadest authenticated reach. Eight of eleven measured accounts used one.
My interpretation is simple. Routine reports don't disappear when an analytics product becomes more advanced. They become the front door to the advanced work.
What happened to the Universal Analytics features people think GA4 removed?
Google maintains a long Universal Analytics to GA4 migration reference. It is accurate, but it reads like a product manual. I reduced the common website workflows to four practical outcomes.
Returned
Annotations now exist in GA4 reports. You can attach a title, description, date or date range, and color to a line graph. Google sets a limit of 1,000 annotations per property, and users need Analyst access or higher to create them.
That's a real return. It doesn't restore the notes you wrote in Universal Analytics. Those belonged to the old property, and Google permanently shut down access to current and historical Universal Analytics data after July 1, 2024.
Bounce rate exists in GA4, but Google defines it differently. It's the percentage of sessions that weren't engaged. An engaged session lasts longer than 10 seconds, has a key event, or has at least two page or screen views. Universal Analytics instead counted single-page sessions with no interaction.
Redefined
Sessions still exist, but GA4's event model doesn't reproduce every Universal Analytics session rule. Use the number inside GA4 consistently. Don't expect a migrated property to match the old property row for row.
Pageviews became Views. GA4 combines web pageviews and app screenviews in the same model. The Pages and screens report is the standard recovery path for website content.
Goals became key events. The name changed twice during the migration era, and the setup moved from the old goal types to event-based definitions. Destination and event goals map reasonably well. Universal Analytics duration goals don't have an exact GA4 replacement, according to Google's migration reference.
Moved
Segments remain available only in Explorations. Editors can now save them at property level for reuse in other Explorations. Standard reports use saved Comparisons, which are dimension-based and aren't equivalent to user-, session-, or event-scoped segments.
Behavior Flow moved to Path Exploration. The new tool can start from an event or work backward from an endpoint. That's more flexible, but it's a builder rather than a finished navigation report.
Saved reports have no exact equivalent. You can customize detail reports if you have enough permission, or save an Exploration. Those are two different surfaces with different limits.
Content Drilldown has no direct folder-style replacement. Use Pages and screens for the table, content groups for your own hierarchy, or Path Exploration when the sequence matters.
Still restricted or absent
Filtered reporting views don't exist in free GA4 as they did in Universal Analytics. Property-level data filters can exclude incoming developer, internal, and web-hostname traffic. These filters apply prospectively and permanently. Subproperties remain an Analytics 360 feature and are the closest replacement for separate filtered views.
Unique Events has no one-for-one metric. Event count tells you how many times an event fired. Total users tells you how many users triggered activity. Neither recreates the old Unique Events rule without a careful scope decision.
Historical Universal Analytics data can't be imported into GA4. Only data collected after the GA4 property was created is available there. If you exported UA data before shutdown, keep that archive for reference. If you didn't, Google says the deleted data isn't recoverable.
The four labels also stop a common migration mistake. A returned feature isn't necessarily continuous with its Universal Analytics version. A moved feature isn't necessarily missing. An absent feature can't be rebuilt by adding one more dimension.
Start with the fate before you start clicking. If the feature returned, learn the new definition. If it moved, save the replacement for repeated use. If it's restricted, decide whether the paid tier solves enough other problems to justify the cost.
This order matters because a clever Exploration can't recover deleted history. A customized report can't reproduce a different session model. A data filter can't create a separate reporting property after the traffic has already arrived.
How do you rebuild the Pages report in GA4?
The quickest path is Reports, Engagement, then Pages and screens. That report already exists, so don't start in Explore unless you need something the standard table can't do.
Google's Pages and screens documentation explains the important naming difference. GA4 starts with page title and screen class because the same report covers websites and apps. For a website, page path is often the more useful dimension.
Change the primary dimension to Page path and screen class. Then add the metrics you use every week. I would start with Views, Sessions, Total users, Average engagement time, Engagement rate, and Bounce rate.
If you have Editor or Administrator access, you can customize a detail report and save that arrangement into the report library. This is the closest way to turn a repeated GA4 task back into a finished report.
There is one permission trap. A Viewer can change the dimension while reading a report, but permanent report customization requires higher access. If the pencil icon is missing, ask a property administrator to save the report once for everyone.
Use an Exploration when you need a combination the standard report can't hold. Google's own Universal Analytics Pages recreation guide tells you to import Page path + query string as a dimension and Views as a metric, then add them to a free-form Exploration.
That works. It is also a good example of what changed. Universal Analytics gave you the report. GA4 gives you the parts.
For normal website analysis, I prefer a page table that starts finished. Clickport's Panels documentation shows the same idea: Top, Entry, Exit, Search, and 404 pages remain separate answers. You can still filter or drill into a session when the question gets deeper.
Where did Channels, Sources, and Campaigns go?
Acquisition is where GA4's scope language matters most.
User acquisition asks how a person first arrived. Traffic acquisition asks how a session began. If someone first found you through Google and returned through an email campaign next week, those two reports can correctly give different answers.
Universal Analytics users often expect one Source/Medium report to cover both jobs. GA4 makes you choose the scope first.
For weekly traffic reporting, start with Traffic acquisition. Change the primary dimension from Session default channel group to Session source / medium when you need the actual source. Use Session campaign when the question is about a tagged campaign.
This distinction is useful once you understand it. It is also one more decision between the question and the answer.
Campaign fields still map to familiar UTM tags. utm_source, utm_medium, utm_campaign, utm_content, and utm_term remain the practical vocabulary. The Clickport UTM guide explains what each field should contain without tying the tags to one analytics product.
Save the acquisition report after you set the dimensions your team uses. Otherwise, someone will repeat the same dimension switch every Monday and eventually export a different scope by mistake.
That isn't a theoretical problem. In our study, Channels, Campaigns, and Sources all landed in the top six routine reports. Acquisition questions aren't edge cases. They're part of the weekly dashboard.
Did GA4 really remove bounce rate, annotations, and sessions?
No, not today. But a one-word answer hides the changes.
Bounce rate returned, but it means something new
In Universal Analytics, a bounce usually meant a single-page session with no second interaction hit. A reader could spend five minutes on one article and still bounce if nothing else fired.
GA4 defines bounce rate as the opposite of engagement rate. Google says a session is engaged when it lasts longer than 10 seconds, includes a key event, or includes at least two page or screen views.
That means a one-page reader who stays for 45 seconds can count as engaged in GA4. The percentage may look better even when visitor behavior didn't change.
Add Bounce rate and Engagement rate to your detail report if you want them. Then document the definition in any client report. Do not place a 2022 Universal Analytics bounce rate next to a 2026 GA4 bounce rate and call the line continuous.
I wrote a separate guide to what bounce rate means because the metric becomes useful only after the definition is clear.
Annotations returned, but your old notes did not
GA4 annotations now support a 60-character title, a 150-character description, a date or date range, and a color. They appear across reports and cards that use line graphs. You can also manage or export them from Admin.
The recovery step is simple. Right-click a point on a report's line graph and select Add annotation. If that action is missing, check your property role. Google requires Analyst access or higher to create, edit, or delete annotations.
The limit is 1,000 per property. That is generous for product launches, campaigns, outages, pricing changes, and tracking fixes.
The hard boundary is history. Universal Analytics annotations were part of the retired property. Google says old Universal Analytics data that wasn't exported before shutdown was permanently deleted. A new GA4 annotation can't bring those notes back.
Clickport annotations live on the same chart as the traffic change. The annotation documentation covers creation, ranges, colors, and visibility.
Sessions stayed, but the comparison changed
Google still defines a GA4 session as a period of interaction that begins when a page or screen opens without an active session. The current session documentation also separates sessions from engaged sessions.
The mistake is not using Sessions. The mistake is expecting a migrated GA4 total to reproduce Universal Analytics exactly.
Use one system for the trend you report. If you must show a migration boundary, label it. A clean break is more honest than a smooth line built from two counting systems.
Which workflows still require Explorations, another product, or GA4 360?
The standard Reports section is only one layer of GA4. A familiar answer can also live in a customized report, an Exploration, Looker Studio, BigQuery, or a 360-only feature.
The location matters because each layer changes the required skill, permissions, retention, and delay.
Segments are the first common surprise. GA4 segments remain in Explorations, although Editors can save them for reuse across other Explorations. Standard reports use saved Comparisons instead. A Comparison is dimension-based, so it doesn't replace every user-, session-, or event-scoped segment.
Behavior Flow becomes Path Exploration. It can work forward from a starting point or backward from an ending point. It can also span sessions. Those are improvements, but you must configure the exploration before the path appears.
Filtered views are the clearest paid boundary. Free GA4 provides prospective data filters for internal, developer, and web-hostname traffic. Google describes subproperties, the broader view replacement, as a 360 feature.
Retention changes by surface. Standard aggregated reports aren't cut off by the event-retention setting. Explorations and funnel reports are. Google lets a standard property keep user-level and event-level data for 2 or 14 months. If you left the setting at two months, changing it later can't restore data already deleted.
Freshness changes too. Google's current guidance lists standard intraday processing at two to six hours, while full processing can take 24 to 48 hours. Reports and Explorations can be temporarily out of sync.
None of these limits makes GA4 useless. They mean the recovery path must include the surface, permission, retention setting, and wait time. "GA4 has the feature" isn't enough information to rebuild a workflow.
Where did my Universal Analytics feature go?
Use this finder when you remember the old feature but not the current path. It covers the twelve workflows in this guide.
The finder gives you a location, not a promise that the workflow stayed the same. Read the warning under each result. The definition or permission is often the part that breaks a migration.
If your old workflow isn't in the list, search Google's migration reference before you assume it vanished. The reference covers ecommerce, advertising links, audiences, custom dimensions, imports, APIs, and mobile apps in much more detail than this website-focused guide.
Then ask one practical question: will your team use the replacement every week?
A feature can exist and still fail as a workflow. If only one trained analyst can rebuild it, the rest of the team doesn't really have the report.
When should you stop rebuilding Universal Analytics?
I don't think every website should leave GA4.
Keep it when you use the capabilities that make its complexity worthwhile. Google Ads audiences, cross-device identity, combined app and website measurement, predictive audiences, and raw BigQuery export are real strengths. Clickport doesn't replace that advertising and data-warehouse stack.
GA4 is also the sensible choice when an analytics team already maintains the reports, naming rules, Explorations, and exports. In that environment, the builder is part of the job.
The line changes when your weekly questions look like our study. Sessions. Channels. Countries. Pages. Campaigns. Sources. Goals. A few filters to understand what changed.
That second job is why I built Clickport. The dashboard starts with the answers our study says customers use most. Sessions, sources, pages, countries, campaigns, and goals are finished reports. Filters, funnels, flows, and individual session journeys remain available when you need them.
You don't have to treat the choice as a religious conversion. Keep GA4 for the integrations only it can provide. Use another dashboard for the daily work. Or replace GA4 when those integrations never mattered to you.
If you switch, preserve any export you still have from Universal Analytics. Then document the change date and expect a new baseline. The migration guide covers the practical steps.
What should you keep from Universal Analytics?
Keep every export you still have. Store the original file without edits, then make a working copy for analysis. Add the property name, export date, date range, timezone, currency, view name, filters, and metric definitions to a short README file beside it.
That context matters more than it sounds. A CSV called sessions.csv won't tell you whether the old view excluded staff, changed currency, or used a custom channel group. Six months later, the number can look precise while the meaning has disappeared.
Don't stitch UA and GA4 into one unlabeled trend line. Put a visible migration marker on the chart. Explain that the collection model, session rules, and several definitions changed. If you need year-over-year reporting, compare each system within its own valid period.
Then rebuild only the reports people still use. Start with Sessions, Channels, Countries, Pages, Campaigns, and Sources. Our study found that these six reports drove 53.7% of deliberate report navigation. Add goals and the filters your team uses every week.
Leave the clever reports until someone asks for them twice. The first request can use an Exploration or an export. The second request proves that the answer deserves a saved report.
This is the part of migration advice I wish existed earlier. You don't need to recreate an entire product. You need to preserve the old evidence, label the break, and restore the short paths that still earn their place.
I still miss parts of Universal Analytics. But I don't want its old collection model or every limitation back. I want the part it got right: a normal question should open into an answer, not a blank canvas.
That is the useful lesson from Universal Analytics. Keep the depth. Put the routine answers first.
Try Clickport free
30 days free. No credit card required.

Comments
Loading comments...
Leave a comment